


Updated August 2026
I have been trading momentum stocks since 1999 and full-time since 2007. In all those years of watching price action, nothing gets the blood pumping quite like a parabolic move. The speed, the volatility, the opportunity, there is nothing else like it in the market.
But parabolic stocks are also where traders go to get wrecked. Chase the wrong side at the wrong time, oversize your position, and you can blow up a month of good trading in a single morning. I have seen it happen to students in the 60-Day Bootcamp more times than I can count. And I will be honest, early in my career, before Paul Singh straightened me out, I did it to myself too.
This post is going to break down exactly how I trade parabolic stocks, on the long side and the short side, including my full exit framework, my specific entry triggers for the short setup, and the MSTR trade from November 2024 that was one of the most satisfying parabolic shorts I have ever executed. By the time you finish reading, you will understand this setup better than 95% of retail traders out there.
What Is a Parabolic Stock?
A parabolic stock is a stock experiencing an exponential acceleration in price, not just a strong uptrend, but a speed-up relative to its prior price action. For the quick definitional version, read my primer on what a parabolic stock is. This page is the full playbook.
Here is the simplest way to think about it: imagine a stock that moves $1 per day for five straight days. On day six, it moves $5 in a single session. That acceleration, that speed-up relative to what came before, is what makes a move parabolic.
Parabolic moves are almost always short-term in nature. The physics of the market do not allow them to continue indefinitely. As price accelerates, two things happen simultaneously: longs who have been riding the move start locking in profits, and short sellers begin circling, knowing a sharp reversal is coming. Eventually supply overwhelms demand and the rubber band snaps back hard. This is a classic day trading strategy. One of my core setups! Check out the other main day trading strategy's we use and put it in your system.
What fuels these moves in the first place? Usually a combination of a strong catalyst, earnings, FDA approval, a short squeeze, news, combined with retail FOMO piling in late. The later the retail crowd arrives, the more extended the move gets, and the more violent the eventual reversal.
Understanding parabolic stocks means understanding both sides of the trade: how to ride one on the way up, and how to trade the collapse on the way down.
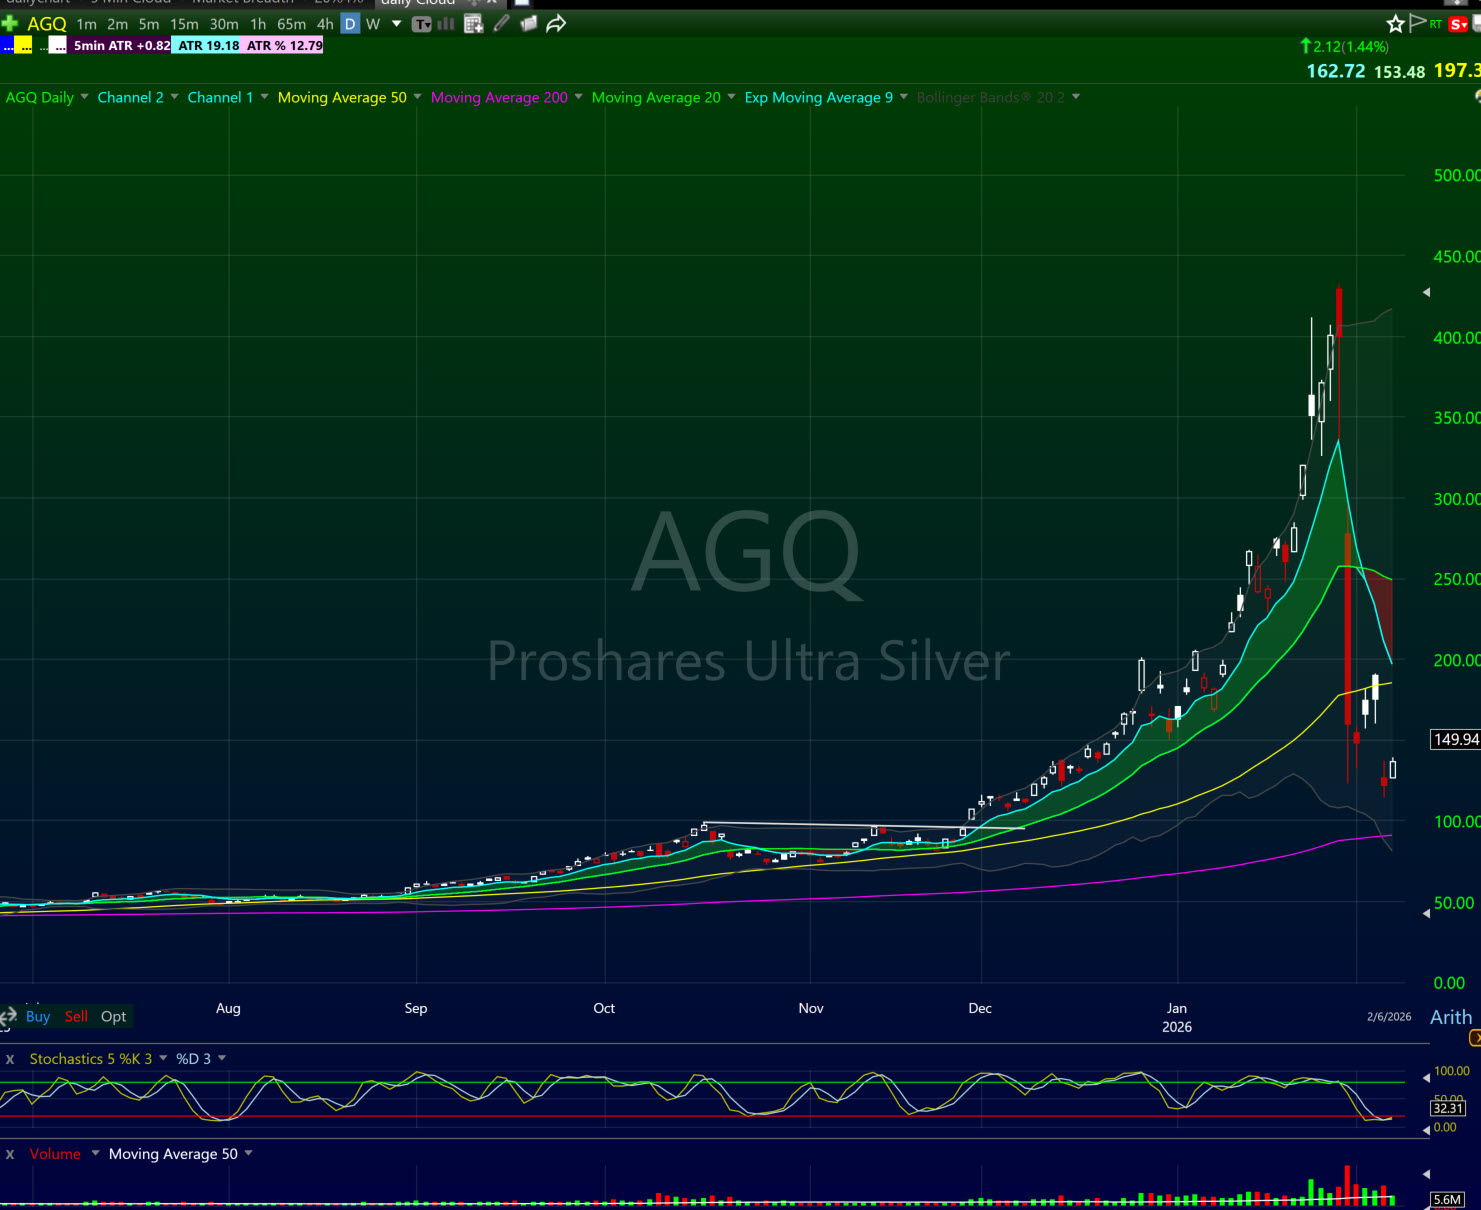
One housekeeping note before we go further. TC2000 is my charting and scanning platform, so its charts always carry a simulated buying power banner. My live executions run through DAS Trader. Every chart in this post is the real setup exactly as I saw it on my screens.
The MSTR Trade: My Favorite Parabolic Short of 2024
I want to start with a real trade because theory without real examples is useless.
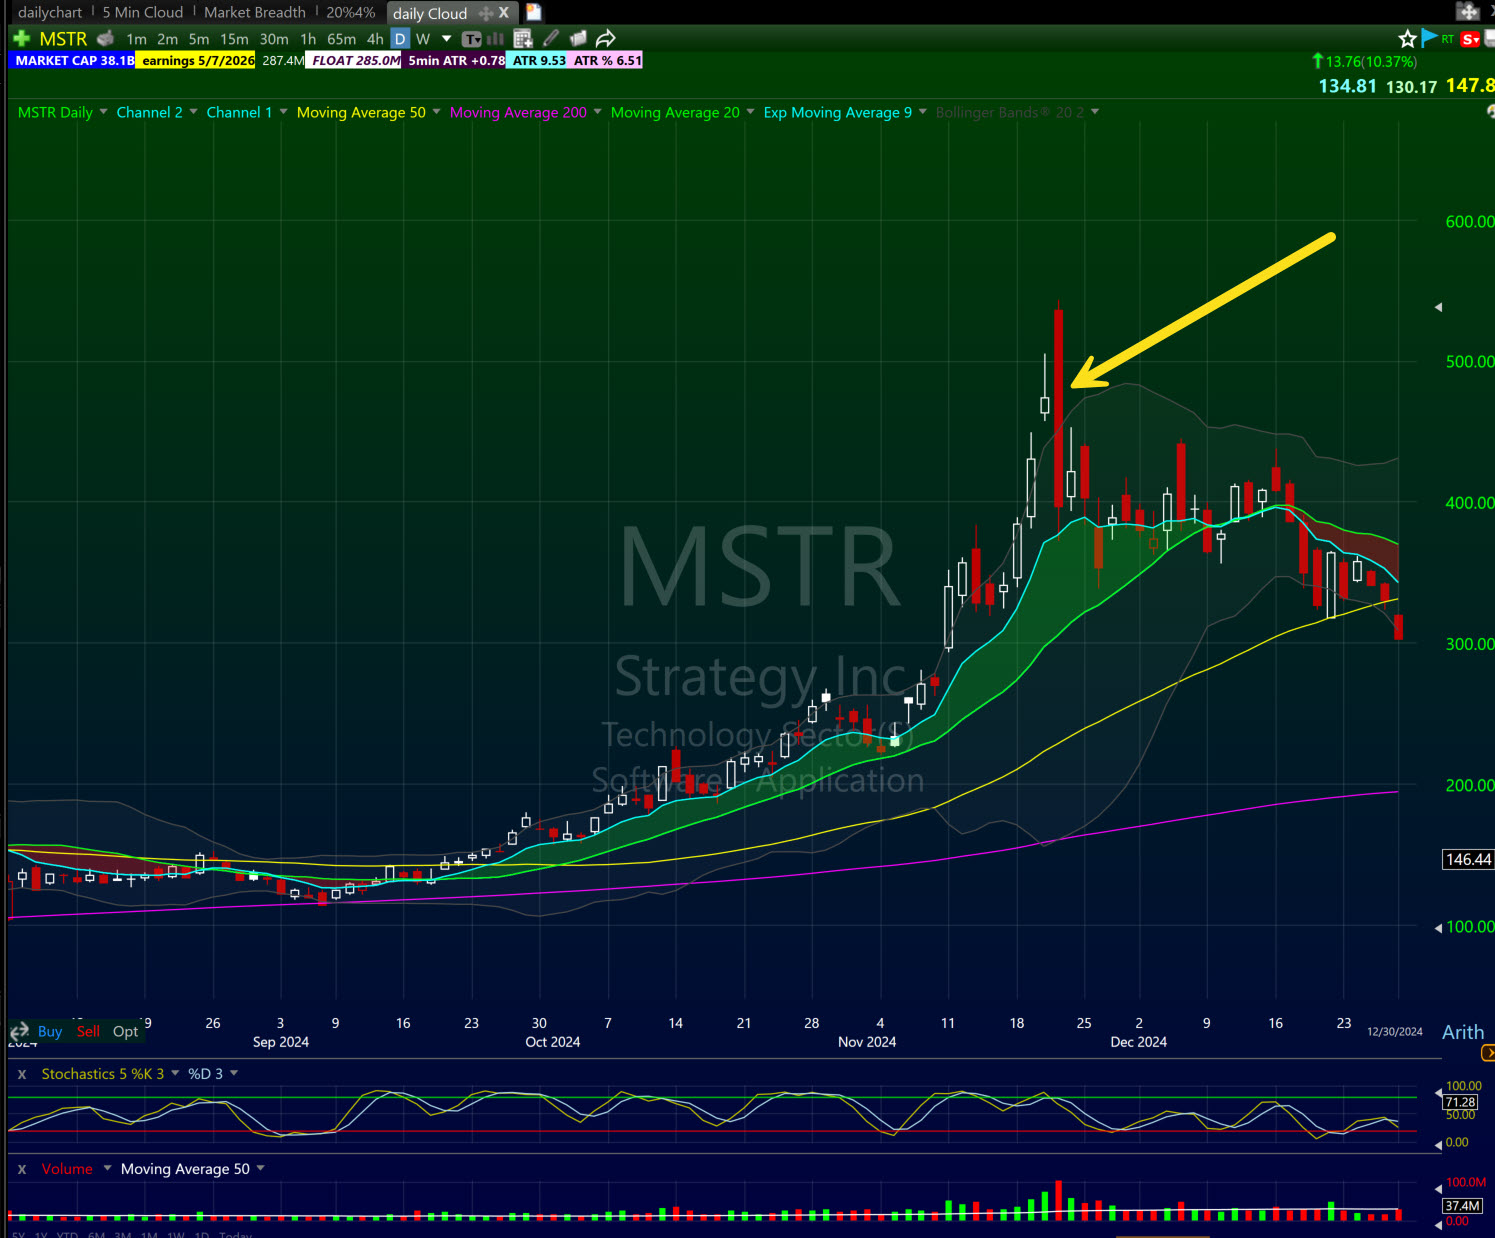
MicroStrategy (MSTR) went on an absolute tear in late 2024, up over 500% in just a handful of months driven by Bitcoin mania and Michael Saylor's relentless BTC accumulation strategy. By November the stock was moving $50 to $100 per day. It was getting naughty, as I like to say. You could feel the exhaustion building.
The stock finally cracked $500 and then gapped up huge on a Thursday morning. The high of that day was $544. Within the first few minutes of the open, I started seeing the signs of the rug, the buying was getting thin, the candles were getting choppy, sellers were stepping in on every pop.
The stock collapsed all the way down to $373 by end of day, right into the 9 EMA on the daily chart. From $544 to $373 in a single session. That is a $171 move.
Here is what made this trade extra sweet: it was a Thursday. Options expiring the next day, Friday, were extremely cheap compared to a normal Monday with a full week of premium. I went in with puts expiring the following day and the trade flew. Because of the timing of expiration, I got enormous leverage on a move that was already huge. If you want to understand how weekly options expiration cycles work and why Thursday puts are priced the way they are, CBOE's options expiration calendar is the definitive reference.
That is the kind of trade that reminds you why you put in the work to learn this stuff. But it only works if you know what you are looking for. Let me break down exactly how I traded it and how you can identify the same setup.
How to Trade the Long Side of a Parabolic Move
Most traders think about parabolic stocks purely as short setups. That is a mistake. Some of the biggest single-day gains I have made have come from riding the long side of a parabolic move, knowing when to get in, when to add, and most importantly when to get out.
Entering on the Long Side
The best long entries in a parabolic move come early, on the first or second day of the acceleration, not after the stock has already tripled. I look for the first pullback setup into the Bone Zone, the shaded area between the 9 EMA and 20 EMA on the 5-minute chart, as the stock is making its initial move higher. That is where momentum traders add with defined risk.
Once a stock has been running for multiple days and is extended well above all moving averages, the risk/reward on new long entries deteriorates significantly. You are no longer trading a setup, you are chasing. And the market will punish you for chasing.
My Dynamic Exit Framework for Long Positions
This is where I part ways with a lot of trading educators who give you a blanket rule like sell when you hit 3:1. I do not use a single exit rule for parabolic longs. The market is too dynamic for that. In a hot market with strong momentum, selling at 3:1 will cost you the real money.
Instead I use what I call a reason-to-sell list. I am watching for specific signals that tell me the move is exhausting:
Whole Candle Outside the Upper Bollinger Band
When I see a full candle, open, high, low, close, printing entirely outside the upper Bollinger Band, that is a strong exhaustion signal. The stock has moved so far, so fast that it is statistically overextended. Snapbacks from this condition are common and often sharp. That is when I start scaling out aggressively.
Multiple Days of ATR Above the 9 EMA
Every stock has an average true range, the average amount it moves per day. When a parabolic stock has moved two, three, or four times its ATR above the 9 EMA, it is telling you the rubber band is stretched. I do not need it to reverse to start reducing my position. The risk/reward of holding has already shifted against me.
Trailing Stop to the 9 EMA
For stocks in strong trends that have not yet shown exhaustion signals, I will trail my stop up to the 9 EMA on the daily chart. As long as price holds above it, I stay in. If the stock gets really extended, I will tighten the trail to the 9 EMA on the hourly chart to lock in more profit while still giving the move room to breathe.
The key is that these rules work together dynamically. I am not looking for one signal in isolation, I am reading a combination of factors and making a judgment call based on what the market is showing me in real time. That is a skill that takes screen time to develop. You can learn the signals in a day. Learning to weight them correctly takes months.
How to Trade the Short Side: The Parabolic Short Setup
This is the setup that can make your month, or blow up your account if you trade it wrong. Let me be direct: the parabolic short is not a beginner setup. Timing the backside of a parabolic move is one of the hardest things you can do in trading. Getting in too early on the front side can be catastrophic.
With that said, when the setup is right, there is nothing more profitable.
What You Are Looking For: The 4 Rules to Qualify a Parabolic Short
Not every extended stock qualifies for a parabolic short. I have a specific set of criteria that must be met before I even consider the setup. Miss one of these and I pass, no exceptions.
Rule 1: Stochastics Over 90
The stochastic oscillator needs to be reading above 90, deep in overbought territory. This tells me momentum has reached an extreme. A stock that is technically extended on price but not showing stochastic exhaustion is not ready. I want to see the indicator confirming what the chart is showing me.
Rule 2: Strong Pierce of the Upper Bollinger Band
The candle needs to be piercing the upper Bollinger Band hard. A strong pierce where the candle body is pushing outside the band is the minimum. A full candle, open, high, low, close, completely outside the band is even better. That is a statistically extreme move and snapbacks from that condition are sharp and fast.
Rule 3: Minimum 3 Days of ATR Extension Above the 9 EMA
The stock needs to have moved at least three average true range lengths above the 9 EMA. One or two days of extension is not enough, the rubber band needs to be genuinely stretched. Three or more days of ATR extension above the 9 EMA tells me the stock is running on fumes, not fundamentals.
Rule 4: Multi-Day Runner, Not a Day-One Earnings Gapper
This is the rule most traders miss. A stock that gaps up huge on day one off fresh earnings news does not qualify. That is a legitimate catalyst with real buyers stepping in, you do not want to be shorting into new information. What I am looking for is a stock that has already been running for multiple days, the news is old, and the only buyers left are retail FOMO chasers who are late to the party. Day one earnings gaps are off limits. Multi-day runners where the catalyst is stale, those are the setups I want.
When all four rules align, that is when I start building my short thesis and watching for the entry trigger. One or two conditions without the others is not a trade. It is a guess.
The Two Thumb Eyeball Check
Here is the shortcut I use when I want to read a chart in two seconds. If I can fit two of my thumbs between price and the 9 EMA on the daily chart, the stock has room to fall. It is the same extension test I use to take profits on the long side, flipped into a short side qualifier. It sounds ridiculous until you realize it is a fast visual proxy for the ATR extension math, and it works on any screen at any zoom. AXTI on August 10 passed the two thumb check with room to spare.
Here is my exact scan on tc2000 for the Parabolic Short you can just click the link add it to your own system.
The Exhaustion Gap: The Ideal Entry Catalyst
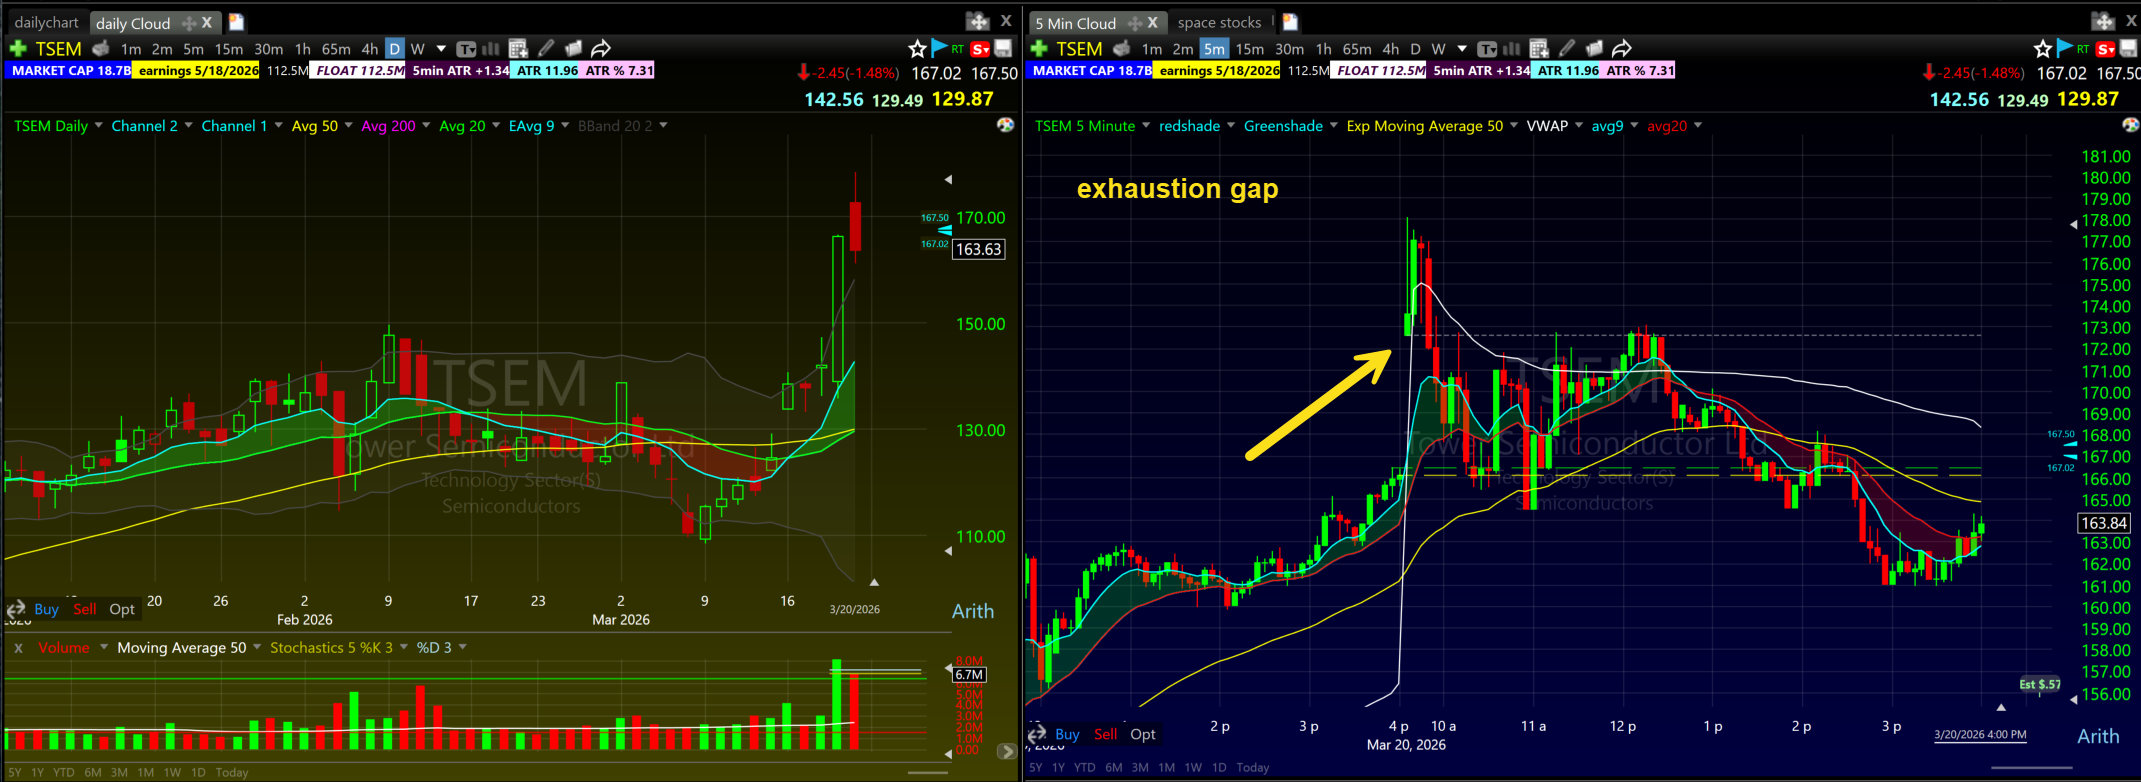
Once a stock qualifies on all four rules, the ideal entry catalyst is what technicians call an exhaustion gap, a final gap up after the stock has already made its big extended run. In the chatroom we call this the sucker's gap.
Here is the psychology: after a stock has run 200%, 300%, 500%, retail traders who missed the move see one more gap up and convince themselves it is going higher. FOMO kicks in. They buy the gap. This is exactly the wrong thing to do, but that buying pressure is what creates the entry opportunity for the short seller.
You can see this dynamic play out in almost every major parabolic top. The sucker's gap is retail's last chance to get in, and the smart money's first chance to get out.
Entry Trigger 1: Opening Range Breakdown
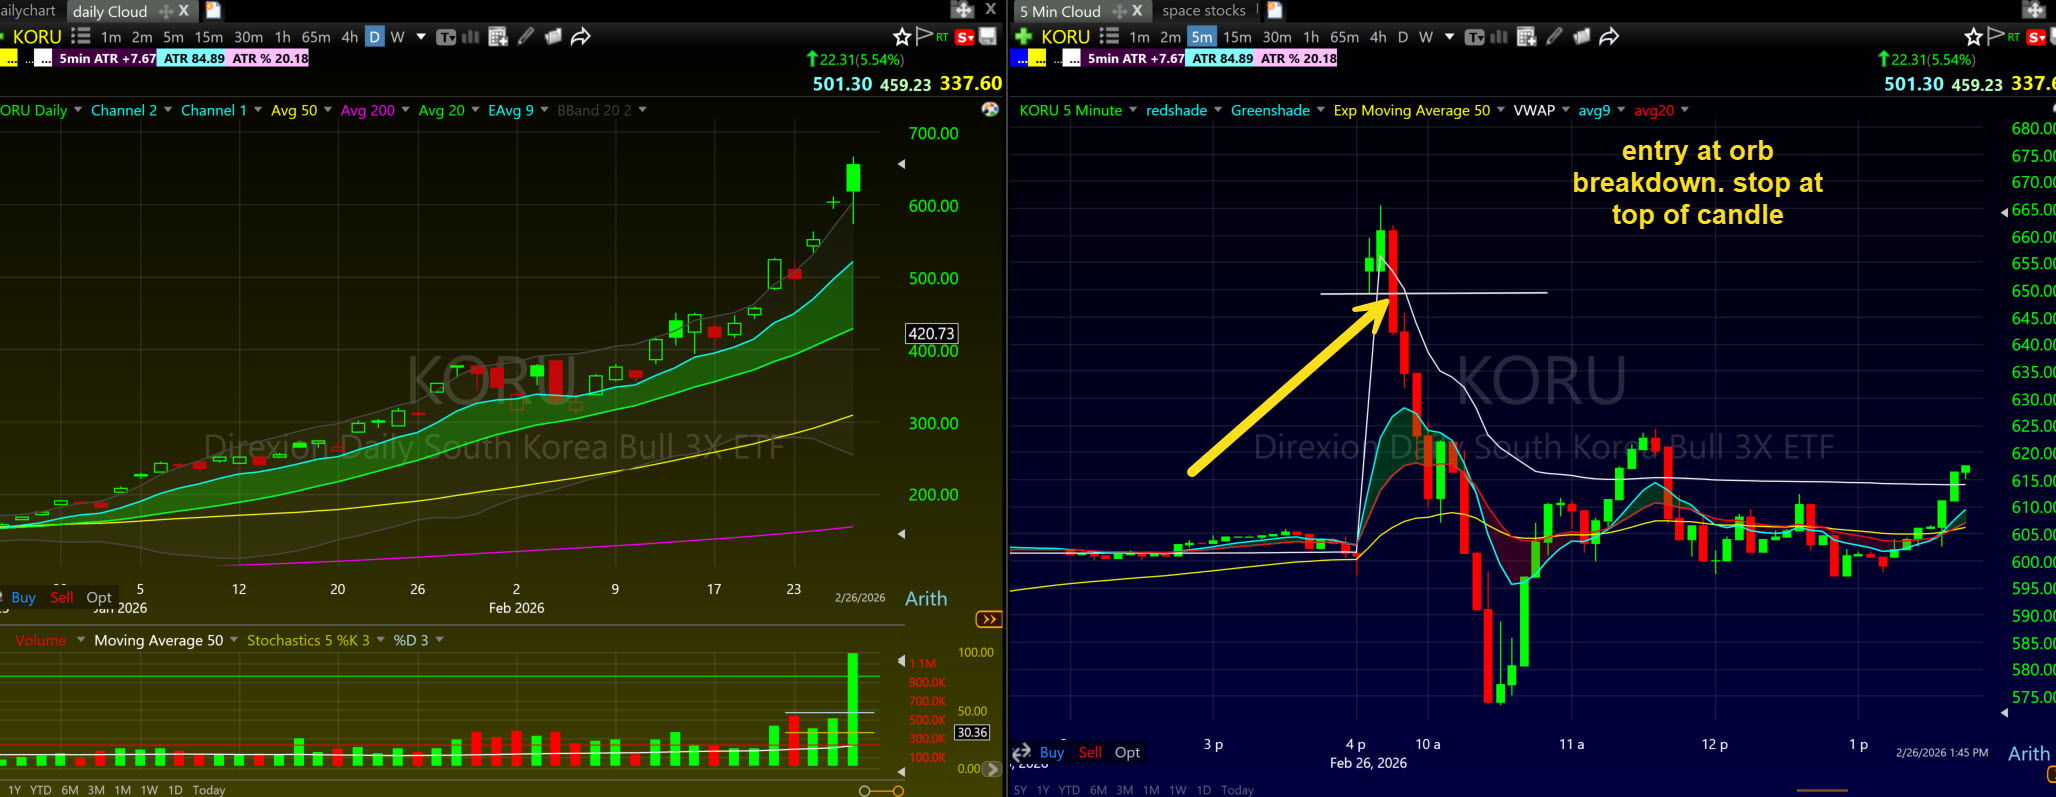
My primary short entry on a gapped-up parabolic stock is the opening range breakdown. It is the same structure I teach on the long side in my opening range breakout guide, run in reverse.
Here is how it works: the stock gaps up, let's say from $90 to $100 at the open. The first 1-minute or 5-minute candle forms the opening range. The bottom of that candle becomes your trigger level. In this example, if the bottom of the first candle is $98, I am watching $98 like a hawk.
When the stock breaks below $98, I enter short. My stop goes above the high of the day, in this case, the $100 gap-up level. The risk is defined. The reward, if the stock collapses back toward prior support or the daily 9 EMA, can be enormous.
This is exactly how the MSTR trade played out. Gapped up to $544. First candle set the range. When that bottom broke, the trade triggered. The stock collapsed $171 in a single session.
Check out this recent example from KORU which is the 3x etf of EWY the Korean markets etf. After such a big run it had a gap up outside of the upper bollinger band. You were 150 points over the 9ema. The stock gaps up makes a range and then when it breaks you take a short position with a stop at the top of the candle.
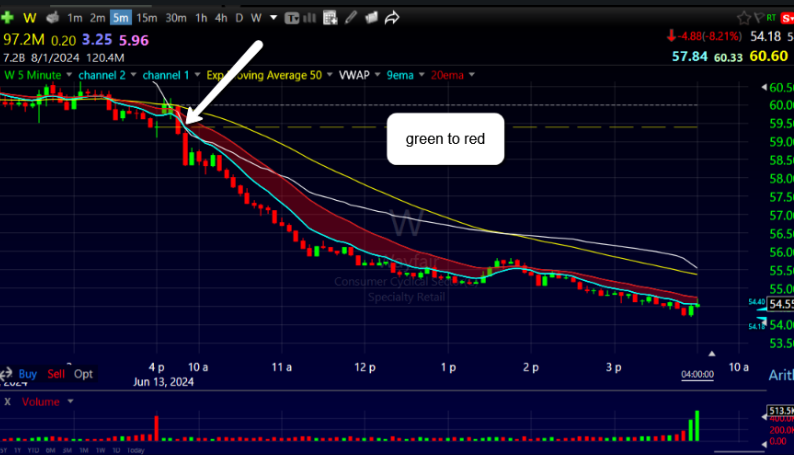
Entry Trigger 2: Green to Red
Not every parabolic short comes with a big exhaustion gap. Sometimes the stock gaps up modestly, or opens flat but extended. In those cases I look for a simpler trigger: the green to red flip.
The stock opens, makes a push higher on the open, then flips red, printing below the prior candle's open. The color of the candles is not the point. The trigger is price breaking under the previous day close. The stock is green on the day, then it goes negative as it cracks that line. On my TC2000 charts I keep a yellow dotted line at the prior day close on every parabolic candidate. When price crosses under the yellow line I have my visual, I take the trade, and the stop goes at the top of the trigger candle. Simple entry, obvious stop placement.
Stop Placement
On both setups, my stop is over the high of day. No exceptions. The high of day on a parabolic stock represents the maximum level of FOMO buying. If the stock reclaims and exceeds that level, the short thesis is wrong and I want out immediately. Note that short selling also requires a margin account, FINRA's short selling rules and margin requirements are worth understanding before you attempt this setup with real capital. If you are doing a VWAP fizzle setup then I would put the stop loss over the VWAP. Always match the stop placement with the intraday setup.
The AXTI Trade: A Complete Parabolic Short Sequence
Theory is cheap, so here is the whole system running live on a single trade. On August 10, 2026 AXTI gave me every piece of this playbook in one session.
The setup had been building for two weeks. The stock bottomed a little under 40, then ran all the way to 90 in under ten days. By Friday it had every telltale sign of a stock that moved too far too fast. The Friday candle printed completely outside the upper Bollinger Band. Price had spent more than two days stretched above the 9 EMA measured in ATRs. Stochastics were pinned in overbought territory. And it passed the two thumb check easily. Everything on the qualification list was lit up.
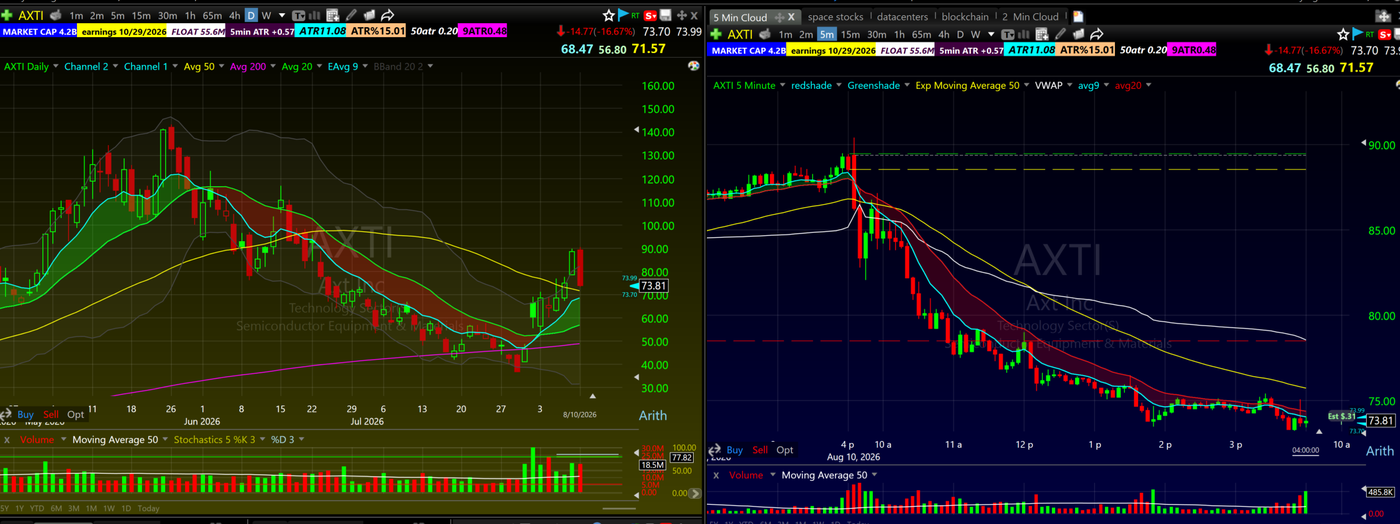
Monday it gapped up small. On the 5 minute chart it pushed just one or two points, a quick spike that lasted minutes, and then it rolled. When price crossed under my yellow dotted line at the prior day close, I shorted at 88.63 with my stop at the top of the trigger candle around 90.50. Risk defined at under two points against a stock that had 15 points of air underneath it.
Then the management sequence, which is where most writeups go silent. I covered half around 84 into the first leg down. The stock bounced back up into the Bone Zone, the area between the 9 EMA and 20 EMA on the 5 minute chart, and failed to reclaim it. That failure is the first pullback setup running in reverse, and it is a re-entry signal. I re-shorted at 86.50. When the stock flushed to the low of day near 83 I covered half of that add into the panic, then trailed the rest down using the Bone Zone itself as my moving stop while the stock bled into the close at 73.70.
Enter on the trigger. Scale into strength down. Reload on the failed bounce. Cover into the flush. Trail the runner with the zone. That is the entire trade management system I teach, and it is the same free trade logic I use on the long side, mirrored.
Shares or Puts: Picking the Right Weapon
The MSTR trade above was puts. The AXTI trade was shares. That was not a mood. It was math, and the option chain made both decisions for me.
MSTR triggered on a Thursday with options expiring the next day, so the premium was dirt cheap relative to a Monday, and MSTR carries one of the deepest chains in the market. Cheap premium plus deep liquidity meant the puts were the leverage play, and the trade flew.
AXTI was the exact opposite. The trigger came on a Monday, when weekly premium is at its most expensive. Implied volatility on the chain was running between 145 and 166 percent, which means the collapse was already priced into the contracts before it happened. And the chain was dead. Several strikes showed volume in the double digits or worse, with spreads close to a dollar wide. Cross a spread like that twice and a home run trade comes back a single.
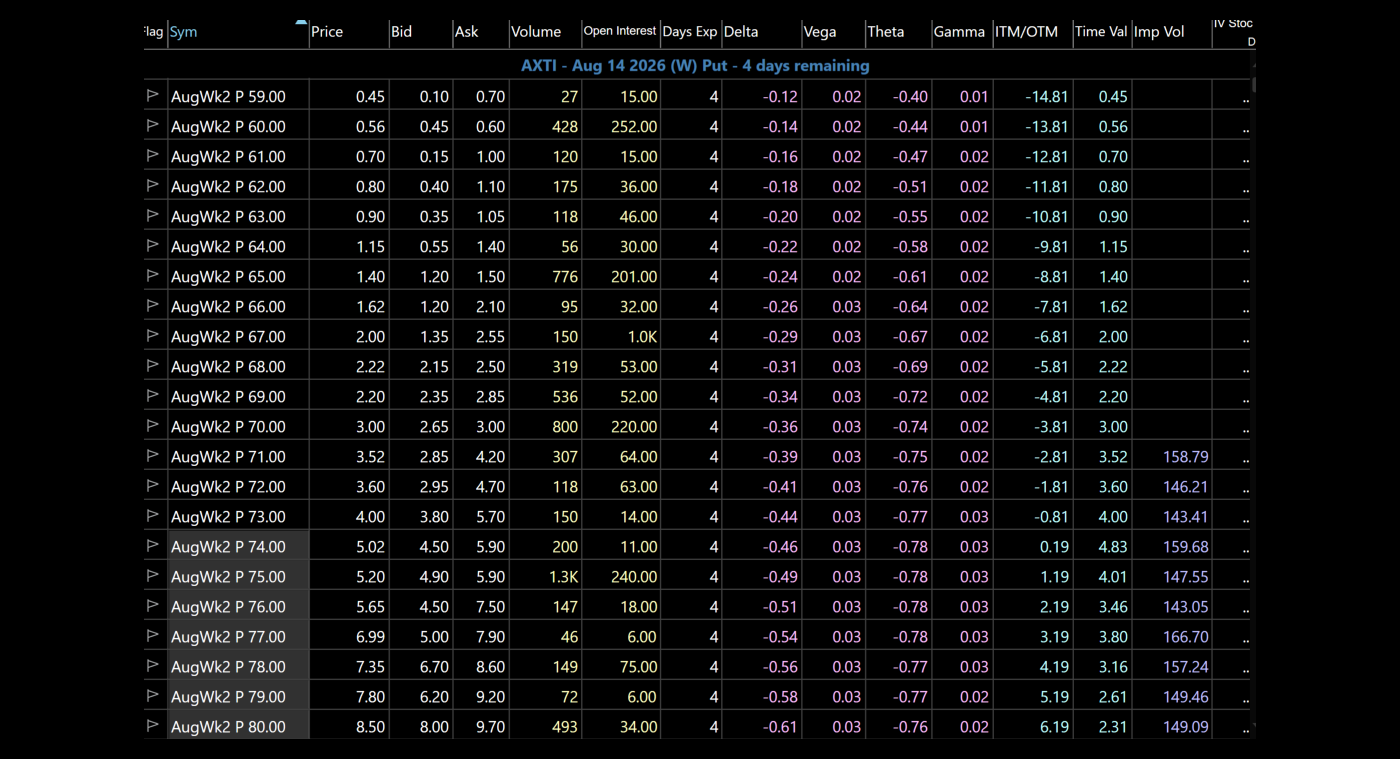
Meanwhile the stock itself was the liquid instrument. AXTI traded 18.5 million shares that day, it was a 90 dollar stock rather than a capital hog, and its ATR was running around 15 percent of price, which means the shares already move like an option without the premium decay.
So here is the rule. The instrument follows the liquidity and the premium, never your preference. Check the chain before you decide, not after. Cheap premium and a deep chain favor puts. Expensive premium, fat implied vol, and a thin chain favor shares, especially when the stock is liquid and affordable on its own. Contract specifications and expiration mechanics are worth knowing cold if you plan to use the options side of this setup.
The #1 Mistake Traders Make With Parabolic Stocks
I have coached over 7,000 students through the 60-Day Bootcamp since I founded Bulls on Wall Street in 2008. I have seen every mistake there is. With the parabolic short setup specifically, the mistake I see most often, the one that causes the most damage, is oversizing.
Here is the reality of this setup that nobody tells you: a parabolic stock can stay extended for multiple days. It can keep going higher after your first short attempt fails. You can stop out small, try again, stop out small again, and then on the third attempt watch the stock collapse 30% and make back everything you lost plus a significant profit.
That is a completely normal sequence on this setup. The problem is that most new traders treat their first attempt like it has to work. They size up big, get stopped out, and either blow their daily max loss or get so emotionally wrecked they cannot pull the trigger when the real entry comes.
The right approach is to hunt the setup in tranches. Your first attempt is a test position, small size, defined stop, no ego. If it works great. If it stops you out, you take a small loss and reset. You are paying tuition to find out where the stock is going. When the real collapse finally comes, you are in it with fresh eyes and the conviction to hold for the full move.
The nuance of accepting multiple small losses to set up one big winner is one of the hardest skills in trading to develop. It requires ego management, patience, and a completely different relationship with losses than most people come into trading with. This is exactly why I tell students on day one of the Bootcamp that they will not be profitable in 30 days. Developing this kind of patience takes time, screen time, and repetition.
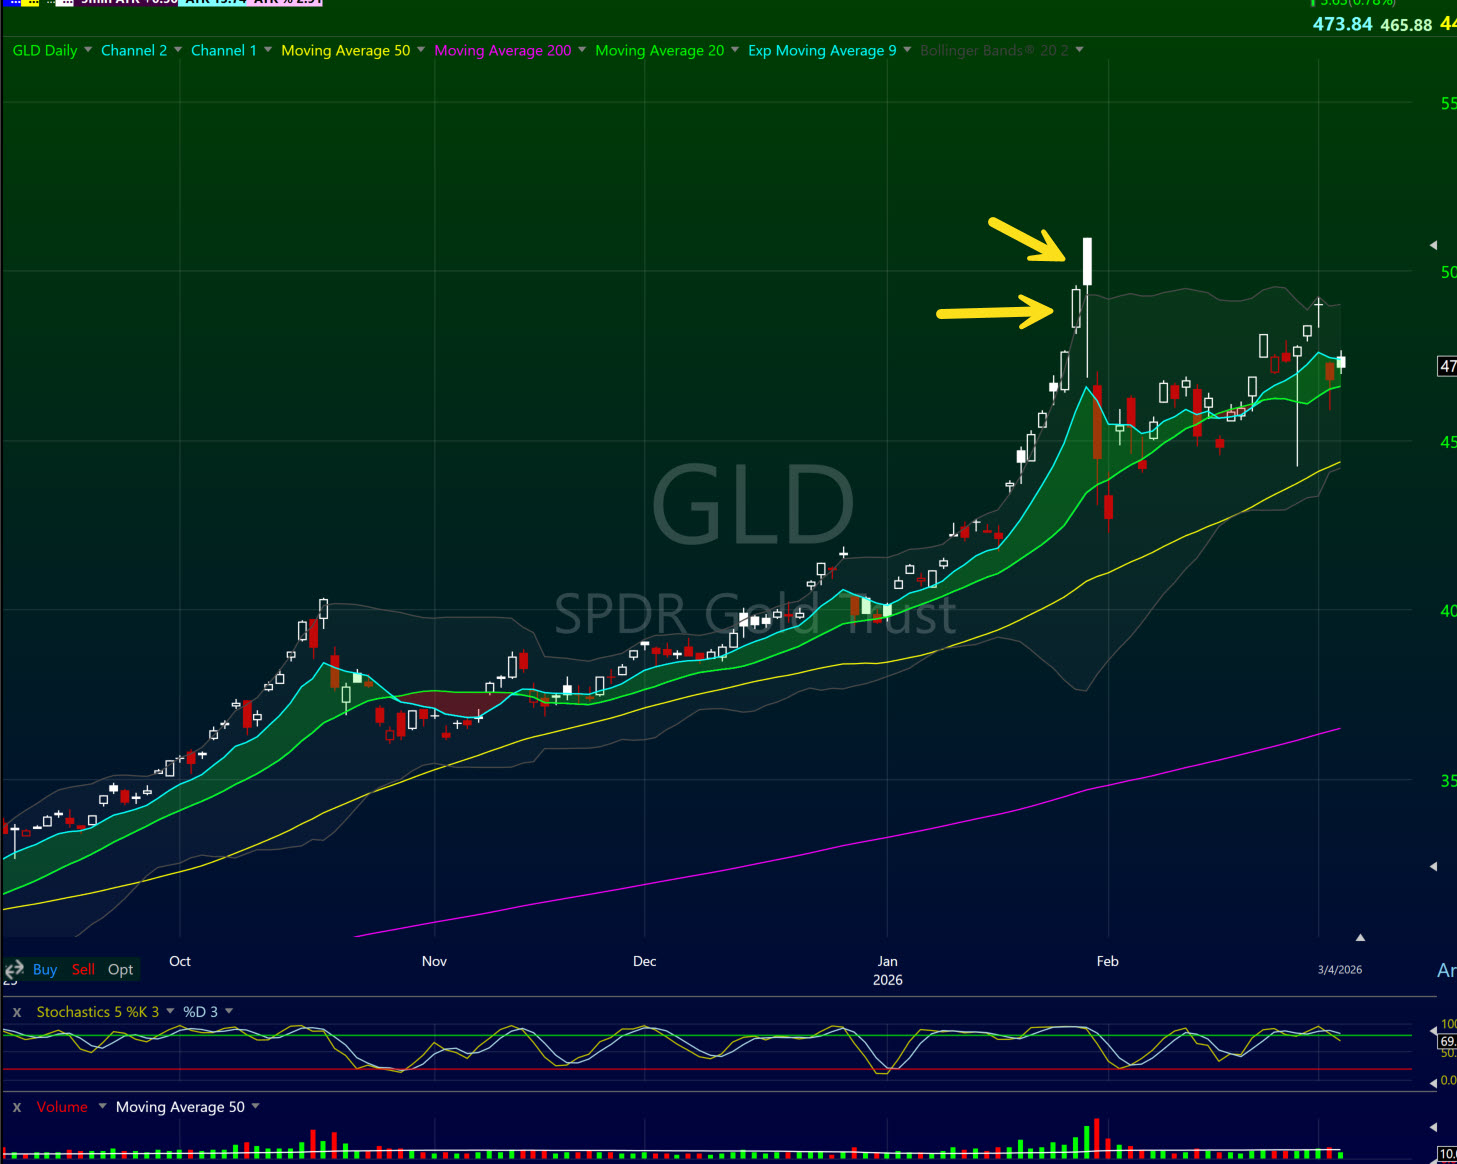
Check out $gld it had numerous days where it looked like it was going to be a short but then it was really the gap down on the 3rd day where it finally trended! Before the big trade came in there was a lot of false signals and stress!
The Fake-Out Comes First: Why Early Shorts Get Destroyed
The sizing mistake costs money. This one costs accounts.
Students see an extended momentum stock open weak and they short the first breakdown they see. Those weak opens are usually traps. The best parabolic shorts almost always print a spike at the open first. Sometimes it lasts a handful of seconds. That quick pop exists to sucker in the last FOMO buyers and to blow out every short seller who got in early with a tight stop. That fuel is what powers the real collapse. Then comes the reversal, and you get your green to red.
Other times the stock gaps up significantly, and the trade is patience: wait for the gap to start filling and the opening range to break down. Either way the market has to clear out the early shorts and trap the late longs before the real move can start. If the exhaustion has not happened yet, your trigger has not happened yet.
And a warning about the lazy version of this trade. An extended momentum stock that simply gaps down 5 percent on a little news is not a parabolic short. A gap down on an extended name attracts every impatient short seller in the market, and those are exactly the traders who get squeezed when it bounces. I want the stock to blow everything out first. The spike, the trap, the reversal. AXTI gave the textbook version: a small gap up, one or two points of push, then the roll.
Scanning for Parabolic Stocks
You cannot trade what you cannot find. My parabolic stock scanner is built in TC2000 and focuses on a few key criteria:
- Price up 20% or more over the past 5 to 10 trading days
- Volume running significantly above the 50-day average, I want to see institutional and retail participation
- Price extended well above the 9ema on the daily chart, I want to see separation
- Stock is in play: news catalyst, earnings, FDA, short squeeze, something driving the move.
I run this scan every night during my pre-market prep. Stocks that show up multiple nights in a row and keep pushing higher move to the top of my watchlist as parabolic short candidates. The more extended they get, the more patient I become, waiting for the exhaustion gap that signals the top is near.
For a deeper breakdown of how I build my scans, check out how to scan for the most explosive stocks to day trade. The same scanner logic that finds momentum longs also surfaces parabolic short candidates when filtered correctly.
You can build these scans yourself using TC2000, it is the platform I have used for over 20 years and the one I teach in the Bootcamp. Or you can use my scan. Here is the rubberband short scan I use personally. There is nothing better for momentum scanning and charting.
The scan finds the candidates, but the entry still comes down to reading candles correctly at the moment of truth. If your candlestick foundations are shaky, grab my free candlestick chart patterns PDF and burn the reversal patterns into memory before you attempt this setup.
Parabolic Stocks vs. Normal Momentum Moves
Not every strong uptrend is parabolic. Knowing the difference will save you from shorting into strength or riding a momentum stock too long expecting a collapse that never comes.
A normal momentum stock trends higher with relatively consistent daily moves, pulling back to its moving averages, and offering clear first pullback entries along the way. The Bone Zone holds on pullbacks. Volume is elevated but not extreme. This is a stock you trade long with trailing stops, adding on pullbacks, holding for a larger trend.
A parabolic stock has broken away from normal momentum behavior. The daily moves are accelerating, each day bigger than the last. Pullbacks to the moving averages no longer happen. Volume spikes to extraordinary levels. Social media is flooded with people talking about it. This is a stock where the risk/reward on new long entries has collapsed and where you start building your short thesis.
The distinction matters because the trading strategy is completely different. A normal momentum stock you buy pullbacks and trail stops. A parabolic stock you are either taking profits aggressively on longs or waiting patiently for the short setup to trigger.
For context on how normal momentum trading works and how to use moving averages to define trend, check out the VWAP indicator guide and our breakdown of day trading fundamentals.
How Extended Is Too Extended: The ATR Extension Rule
Everything above tells you what a parabolic move looks like. This tells you how far along it is, in numbers, before you risk a dollar.
I keep two ATR readings on my chart toolbar at all times. How many ATRs a stock is away from its 50 day moving average, and how many ATRs it is away from its 90 day moving average. Those two numbers decide what I am allowed to do with a name that has already run.
More than 7 ATRs above the 50 day moving average
If a stock is more than 7 ATRs above the 50 day moving average, I find that it is too extended historically to do any swing trades on it. Period. That is a hard line and I do not negotiate with it. The fresh trend is already spent, and a swing trade is a bet on a trend continuing over weeks.
But I will still day trade it aggressively. Day trades are based off the 5 minute chart anyway, and often those stocks sitting that far above the 50 have the biggest ranges and are the biggest trenders on the screen. Same stock, different answer depending on the timeframe.
This is exactly why parabolic names are simultaneously the best day trading vehicles and the worst swing vehicles on the market. The extension that disqualifies the hold is the same extension that creates the range.
Three or more ATRs above the 90 day moving average
If a stock is 3 or more ATRs above the 90 day moving average, it is getting extended. That makes it a possible candidate for a mean reversion play for a couple of days, which is the short thesis in this entire guide expressed as a number.
It is also a big no no to hold long. The snapback to the 90 could come at any moment. Not a prediction that it will, an acknowledgment that when it does it will be fast and it will not wait for you to be at your desk.
Run those two readings on any name in this post and you will see why the setups work. Both numbers live on the chart toolbar I use every day, and I break down how to build that toolbar in my guide to the TC2000 layout I have traded from for 20 years.
Risk Management on Parabolic Trades
Given the volatility of parabolic stocks, risk management is non-negotiable. A few rules I never break:
Position sizing: Because I expect to take multiple attempts on the short side, each individual attempt is smaller than my normal position size. I might take three attempts at 30% of my normal size rather than one attempt at full size. Total risk exposure stays controlled even as I take multiple shots.
Here is the exact ladder in 1 percent rule terms. These are high reward setups when they hit, but they are high stress trades and the win percentage runs lower than trend trades because you are fighting momentum. So in a hot market my first attempt on a parabolic short risks 0.5 percent, half my normal unit, because I know it may take a couple of tries before I nail it. Once the stock cracks and proves itself, the game changes. The flush confirms the thesis, the first pullback short into the Bone Zone sets up, and I will scale risk up to 1.5 percent on the continuation, because a cracked parabolic usually hands you multiple opportunities. Probe small on the unproven front side. Get paid on the proven back side. Most losing traders run this exactly backwards: full size on the guess, nothing left for the confirmation. My complete framework for this lives on the risk management hub.
Daily max loss: I set a hard daily max loss before I start trading. If the parabolic short stops me out twice in a row and I am approaching my max, I step back. The setup will be there tomorrow. Protecting capital is always more important than catching the trade.
Stop discipline: My stop is over the high of day and I do not move it. If the stock reclaims the high, I take my loss and reassess. Parabolic moves can extend further than logic suggests, the stock that looks impossibly extended at $100 can absolutely go to $150 before it collapses. My stop protects me from finding out the hard way. The SEC's investor guidance on trading risks is also worth a read if you are newer to trading volatile momentum stocks.
For a full breakdown of how I think about risk at every position size level, read the risk management guide for day traders.
FAQ: Parabolic Stocks
How many ATRs above the 50 day moving average is too extended? More than 7. At that point I will not take a swing trade on it, because the fresh trend has already been spent. The same stock often remains an excellent day trading candidate off the 5 minute chart, because that extension is exactly what creates the wide range.
What does it mean when a stock is 3 ATRs above its 90 day moving average? It is getting extended and becomes a candidate for a mean reversion play over a couple of days. It is also a poor candidate to hold long, because the snapback toward the 90 can come at any moment and it comes fast.
What is a parabolic stock? A parabolic stock is a stock experiencing an exponential acceleration in price relative to its prior price action. The defining characteristic is not just a strong move, it is a speed-up where each day's move is larger than the last, creating a curved, nearly vertical price chart.
How do I know when a parabolic move is ending? Key exhaustion signals include: a full candle printing outside the upper Bollinger Band, price extended multiple ATRs above the 9 EMA on the daily chart, a gap-up open after multiple days of big gains (the sucker's gap), and declining volume on up days. No single signal is definitive, look for a combination.
Is it better to trade parabolic stocks long or short? Both sides offer opportunity but require different skills. The long side requires patience to enter early and discipline to exit before the collapse. The short side requires timing, a tolerance for multiple failed attempts, and iron-clad stop discipline. I recommend new traders focus on the long side first and leave parabolic shorts until they have significant screen time.
What is an exhaustion gap? An exhaustion gap is a final gap-up that occurs after a stock has already made a large extended run. Unlike a breakout gap that signals the beginning of a move, an exhaustion gap marks the end, retail FOMO buyers pile in on the gap, creating the last burst of buying that shorts use as their entry opportunity.
How do I find parabolic stocks to trade? Scan for stocks up 20% or more over 5 to 10 days, trading on significantly above-average volume, with a news catalyst driving the move. TC2000 is my preferred platform for these scans. Check the list every night, stocks that appear multiple sessions in a row and keep pushing are your best parabolic short candidates. Here is the scan I use for rubberband shorts.
What is the biggest risk when shorting a parabolic stock? Getting in too early. Parabolic stocks can extend far beyond what logic suggests. The stock that looks overdone at $50 can go to $100 before it collapses. Using small test positions, defined stops over the high of day, and taking multiple tranches rather than one big bet protects you from this. This setup often takes 2 or 3 tries before you nail it. Look at Gold end of January 2026. It was overbought for days and then had 2 more days outside the upper bollinger band before it dumped hard.
Can parabolic moves last for weeks? Yes. MSTR ran for months before finally topping in November 2024. This is why I stress patience on the short side, you may be right about the eventual collapse but wrong about the timing. The market does not care that the stock looks extended. It collapses when it is ready, not when you need it to.
What role does options play in parabolic trades? Options can amplify your returns dramatically on parabolic shorts because implied volatility is typically elevated, making puts expensive. However, expiration timing matters, buying puts with very short expiration (as I did with MSTR, buying Friday puts on a Thursday) can be highly profitable when timed correctly but requires precise execution. This is an advanced strategy.
Should beginners trade parabolic stocks? The long side in moderation, yes, with small size and tight stops. The short side, no. The parabolic short requires experience, emotional control, and the ability to absorb multiple small losses while hunting for one big winner. Build your skills on simpler setups first through the 60-Day Bootcamp before attempting parabolic shorts.
How is a parabolic stock different from a regular momentum stock? A momentum stock trends higher with consistent daily moves and regular pullbacks to its moving averages. A parabolic stock has broken away from normal behavior, moves accelerate each day, no pullbacks occur, and volume explodes. The trading approach is completely different: you buy momentum pullbacks, but on parabolic stocks you take profits aggressively on longs and look for short opportunities.
What timeframes work best for trading parabolic stocks? I use the daily chart to identify the setup and gauge overall extension. I use the 5-minute chart for precise entries and exits intraday. The hourly chart is useful for trailing stops on the long side when a stock is in a strong trend but showing early exhaustion signs.
What happens after a parabolic stock collapses? Most parabolic stocks retrace a significant portion of the entire move, often 50% to 80% of the run, before finding real support. The first major support level is usually the daily 9 EMA, which is why I use it as my initial profit target on parabolic shorts. After that, prior consolidation zones and the 20 EMA on the daily chart become the next levels to watch.
What is the two thumb rule for parabolic stocks? Hold two thumbs up to the daily chart. If they both fit between price and the 9 EMA, the stock is extended with room to fall. It is a fast visual proxy for measuring extension in ATRs, and it works as both a profit taking signal on longs and a qualification check on parabolic shorts.
Should I short parabolic stocks with shares or puts? Let the option chain decide. Cheap premium and deep liquidity favor puts, like MSTR triggering on a Thursday before expiration. Fat implied volatility, thin volume, and wide spreads favor shares, like AXTI at roughly 150 percent IV while the stock itself traded 18.5 million shares. Check the chain before entry, never after.
How much should I risk on a parabolic short? Less than a trend trade at first. The win percentage runs lower because the trade fights momentum, so a first attempt in a hot market gets about 0.5 percent risk. Once the stock cracks and the continuation confirms, risk can scale toward 1.5 percent because a broken parabolic usually offers multiple entries.
Why is a gap down on an extended stock not automatically a short? Because the blow-out has not happened. A quiet gap down attracts every impatient short seller, and those early shorts become the fuel for a squeeze. The high probability version needs the fake-out first: a spike that traps late buyers and stops out early shorts, then the green to red or opening range breakdown trigger.
MU: The Parabolic You Do Not Trade
Every framework needs its counterexample, and mine is Micron.
I watched MU for weeks in 2026. The stock ran from 60 to over 1,200 in the course of about a year, and near the highs it printed everything this post teaches. Extended, overbought, stochastics pinned, candles riding outside the band. A couple of times I looked at it and thought this is an epic parabolic short. I tried it twice.
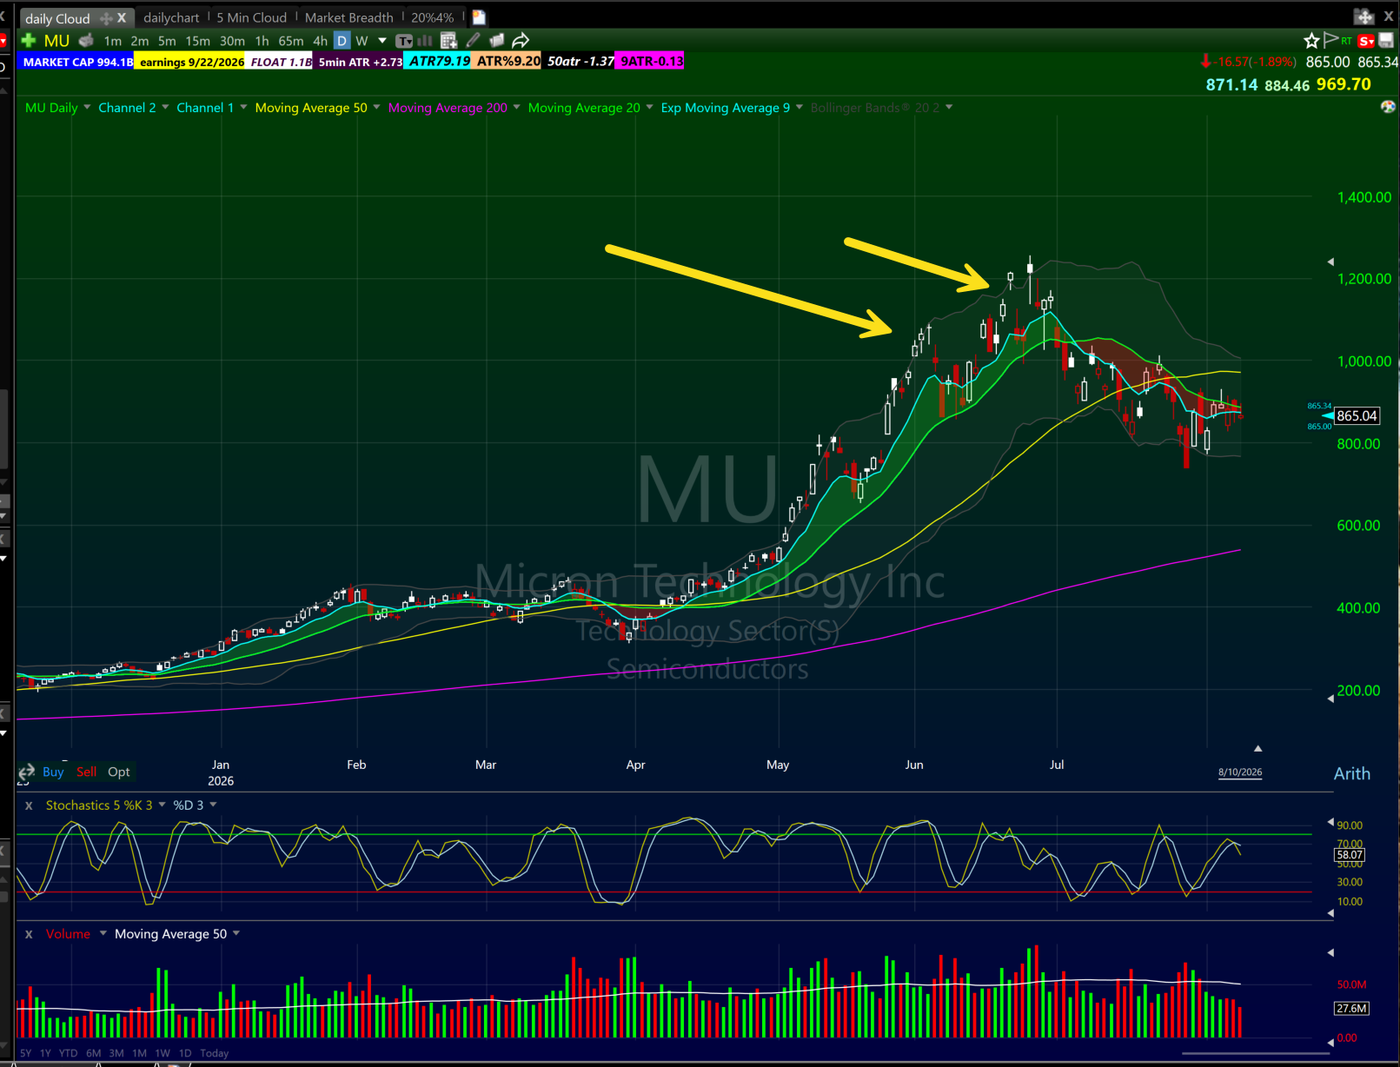
Here is what made it untradeable. Every time the daily chart triggered, the resolution came the next morning as a gap down instead of an intraday collapse. The memory sector news cycle out of Korea was driving the stock, and those headlines hit while the US market was closed. Instead of a gap up I could fade as it rolled red, the move I wanted kept happening in the premarket, where there is no trigger candle to enter against and no clean level to stop against.
The lesson matters more than the ticker. Every trigger in this playbook is an intraday event. Green to red, the opening range breakdown, the Bone Zone reload. They all require the collapse to unfold during regular hours where you can define risk against a candle. When the catalyst lives in another time zone, the move lives in the gap, and a gap cannot be stopped against. MU eventually cratered from over 1,200 into the 800s, so the thesis was right. The profit went to whoever was carrying overnight gap risk, which is a different trade with a different risk profile than anything on this page. Knowing when a parabolic is not your trade is part of the edge.
The Bottom Line on Parabolic Stocks
Parabolic stocks are one of the most exciting and potentially lucrative setups in momentum trading. They are also one of the most dangerous for traders who do not understand what they are doing.
The framework is straightforward: identify the exhaustion signals, wait for the right entry trigger, define your risk with a stop over the high of day, and take multiple small attempts on the short side rather than betting everything on one entry. On the long side, use a dynamic reason-to-sell list instead of a rigid exit rule, the Bollinger Band extension, ATR above the 9 EMA, and trailing stops to the 9 EMA give you the flexibility to ride strong moves without giving back all your profits.
I traded my first parabolic short sometime around 2006, early in my development as a trader. It took me years to truly understand the nuance of sizing down, taking test positions, and hunting for the bigger collapse rather than forcing every attempt to work. That patience is what separates traders who make money on this setup from traders who get chopped up repeatedly.
If you want to learn this setup in depth, with live trade examples, real-time market recaps, and the ability to watch me trade it myself in the chatroom, the 60-Day Live Trading Bootcamp is where we go deep on every momentum setup I trade, including the parabolic short. Over 7,000 traders have gone through it since I founded Bulls on Wall Street in 2008. It is the most comprehensive live trading education program in the industry.
Watch me break down parabolic setups live on YouTube: youtube.com/@kunaldesaitrading
Trade well, Kunal
Kunal Desai is the CEO and founder of Bulls on Wall Street. A professional trader since 2007, he has navigated every major market cycle, from the 2008 financial crisis to today's high-volatility environments. Having mentored thousands of students through over 79 intensive trading bootcamps, Kunal is dedicated to teaching real-world execution and high-probability strategies. Based in Miramar Beach, Florida, he balances the intensity of the trading desk with a focus on fitness, family, and performance cars.
Connect with Kunal: Read his full story here | Instagram | YouTube
This strategy is part of our complete day trading strategies guide covering the setups professional traders use every single day.