

How to Scan for Stocks to Day Trade: My Exact Daily Routine
Updated March 2026
I have been trading full-time since 2007. Every single morning, before the market opens, I am running scans. Not because someone told me to. Because I learned the hard way — in my early years, I walked into the trading day blind. I had no watchlist, no filters, no plan. I was reacting to whatever popped up on CNBC or showed up in a trading chat room. That is a recipe for getting destroyed.
There are over 5,000 publicly traded stocks on the NYSE and Nasdaq. Every day, hundreds of them are moving — on news, on technicals, on momentum, on sector rotation. Your job is not to trade them all. Your job is to find the 5 to 10 that actually have a shot at making a clean, high-probability move — and ignore everything else.
That is exactly what a stock scanner does. And in this post, I am going to walk you through the exact system I use at Bulls on Wall Street, built around TC2000, the platform I have used every day for over two decades.
A Real Example Before We Get Into the Filters
HIMS — Hims & Hers Health — is a perfect case study for why scanning for relative volume changes everything.
For months, HIMS was a dead stock. It had been in a full phase 4 downtrend, sliding from $50 all the way down to $15. Red Bone Zone the entire way down. Nobody was paying attention to it. Volume was low, price action was lifeless, nothing to trade.
Then the news hit: Novo Nordisk — the company HIMS had been in a legal dispute with — announced they were not only ending the lawsuit but actually partnering with HIMS. That changed everything overnight.
The next morning, my pre-market scanner lit up. HIMS was showing the biggest relative volume it had seen in months. The catalyst was real, the volume was real, and the stock was gapping hard off years-long lows.
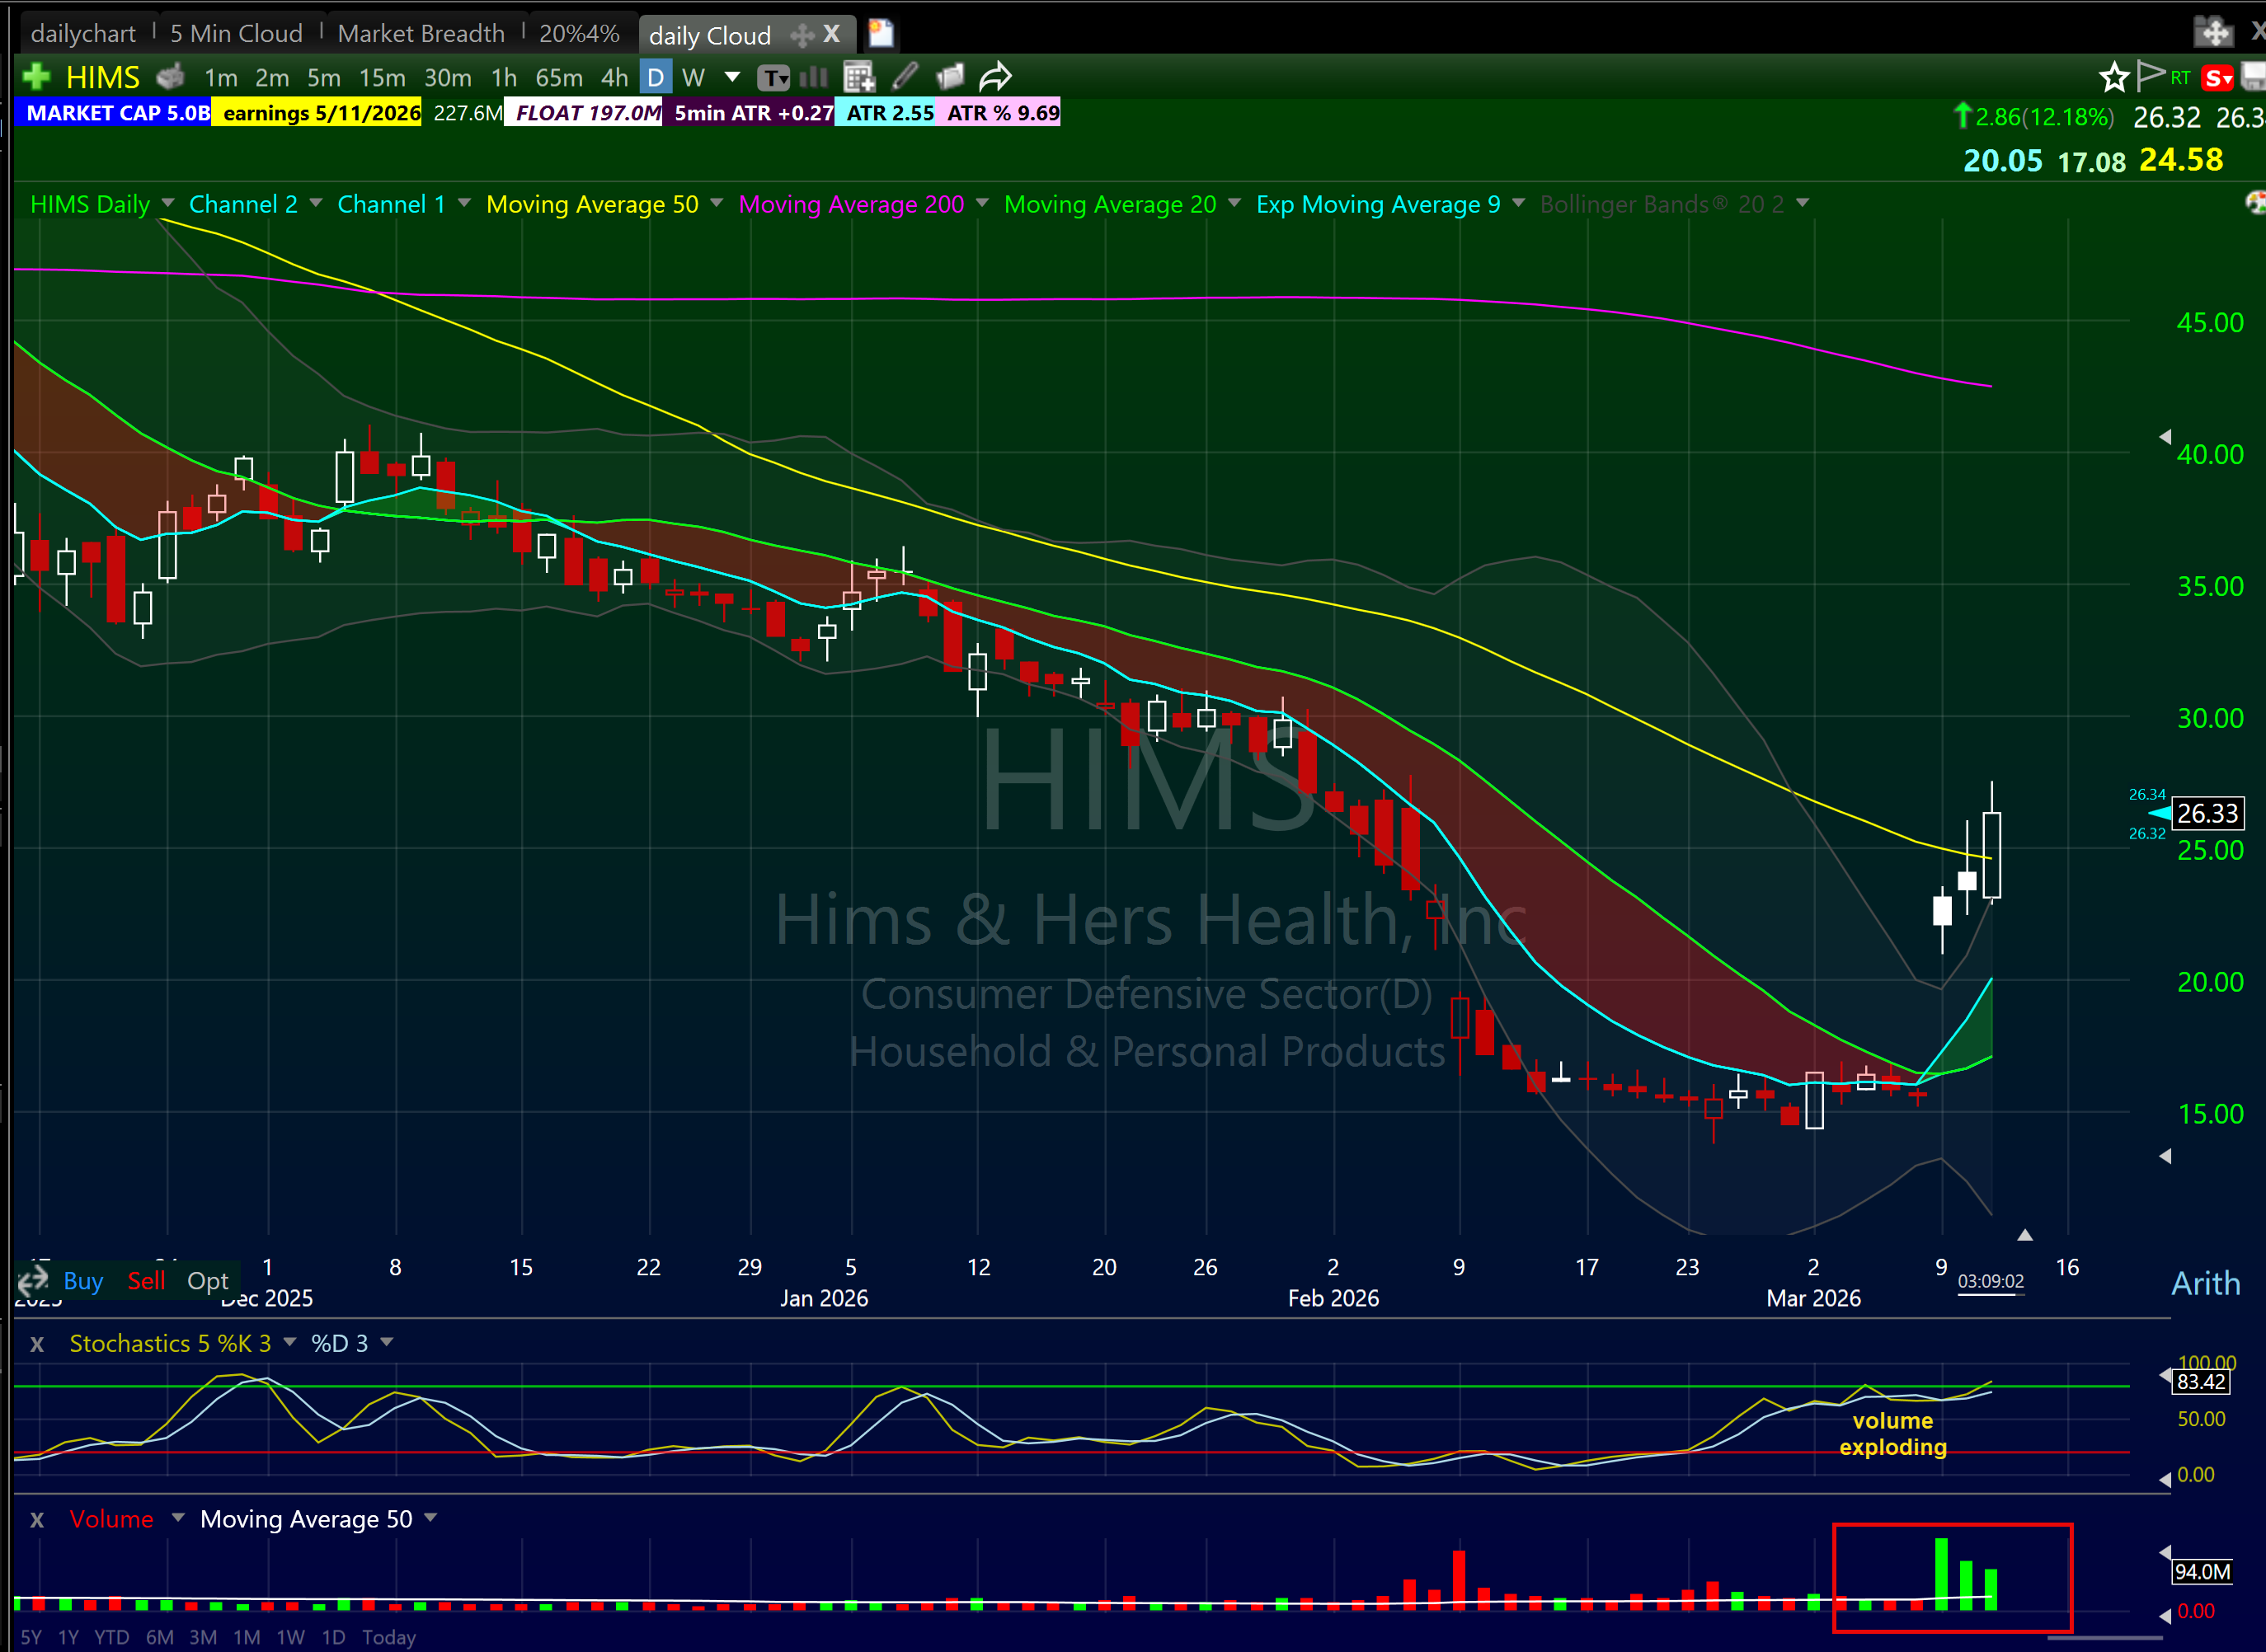
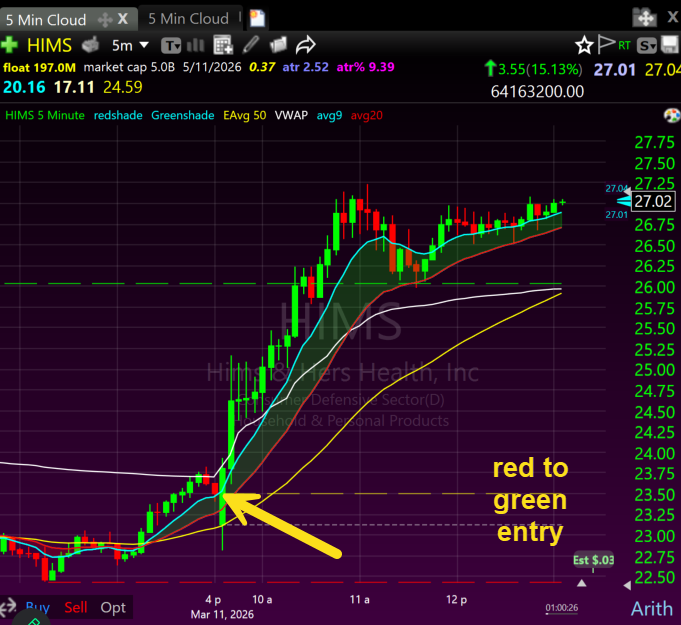
It did not go straight up. It chopped for two days after the initial spike — which is exactly what you expect. Big news, big volume, then a period of digestion where the stock builds a new range. Then on day 3, it took out that entire range with conviction.
I traded it on day 3 using a red-to-green entry. HIMS opened slightly below the previous day's close, dipped briefly into the red, then crossed back above that level on volume. That crossover — the previous day's close acting as the line in the sand — was the entry signal. Once it went green, the Bone Zone on the 5-minute chart (the area between the 9 EMA and 20 EMA) held the entire move. Stock ran from the low $23s all the way to $27 without looking back.
That is how scanning for relative volume works. Without the scanner, HIMS is just another stock you might have caught on a news headline after it already moved 15%. With the scanner, it is on your radar the moment the volume explodes — before the move gets away from you.
What I Did Before I Had a Real Scanner (So You Never Have To)
I started trading in 1999. TC2000 was called Telechart back then — and I did not even have that at first.
My early scanning routine was embarrassing by today's standards. I was literally reading the newspaper looking for stock ideas. Then I graduated to Yahoo Finance forums and MSN Money message boards — pure noise. Retail traders pumping garbage, chasing tips, nobody with a real edge.
The place that actually taught me something was TheLion.com. A forum built specifically for short-term traders, and it was the wild wild west. But unlike Yahoo Finance, there were actual professional traders on there — people with real skills, real swagger, and big ideas. I met some of my closest friends to this day through that forum. Superman Trades, Bman Microcaps, Timothy Sykes — names that will mean something to anyone who was in that world in the early 2000s. TheLion is where I first learned how news moves stocks and how to play press releases. Genuine education.
But here is the problem with all of it: I was reactive. Someone posted an idea, I chased it. I read a headline, I bought it. No filter, no criteria, no system. I was walking into the market every day with no real watchlist and hoping something would work out.
That approach cost me years of consistency. The day I got Telechart — eventually TC2000 — and started building actual scans with real criteria, everything changed. Instead of reacting to what other people found, I was finding it myself, first, with a defined reason for every name on my list.
That is the difference between scanning and gambling. One has a process. The other has hope.
Why Most Traders Scan Wrong
Before I give you the filters, let me save you some pain.
Most beginner traders open a scanner, see a list of 200 stocks moving, and try to track them all. That is not scanning. That is chaos. The whole point of a scanner is to cut that list down to a manageable number — ideally 5 to 15 names — so you can focus on executing clean setups instead of chasing random movement.
The second mistake is using the wrong criteria. Traders filter by dollar volume, or earnings, or random technical indicators they read about online. None of that matters if the stock does not have the two things that create day trading opportunity: liquidity and volatility.
Liquidity means you can get in and out without slippage. Volatility means the stock is actually moving enough for a trade to be worth making.
Every filter I use comes back to those two things.
The Three Scans I Run Every Day
I break my scanning routine into three windows: nightly, pre-market, and intraday. Each one serves a different purpose. Together, they give me a complete picture before the opening bell.
Scan 1: The Nightly Scan (Run After 8 PM)
The nightly scan is the foundation. I run it after post-market trading closes, usually between 8 and 9 PM. By that time, all the after-hours moves are visible — earnings reactions, news events, analyst upgrades. Whatever moved after the bell shows up clean.
This is when I build my watchlist for the next day. I am looking for stocks that showed strength or weakness during the session, or that are reacting to news after hours. Those tend to follow through the next morning with the setups I trade.
My nightly scan criteria in TC2000:
- Volume: minimum 1 million shares traded that day
- Relative volume: 2x or higher versus the 30-day average
- Price range: $5 to $500
- Percentage change: up 3% or more (for longs) or down 3% or more (for shorts)
- Float: under 100 million shares preferred, but not a hard cutoff
The float filter matters because low float stocks are rowdier. When a stock only has 20 or 30 million shares outstanding and suddenly trades 15 million of them in a day — that is enormous turnover. Price moves fast. For day trading, that is the environment we want.
Once the scan returns results, I am not done. I flip through every chart on the list. I am looking for named setups — a flag forming, a flat top building, a stock sitting right under a key resistance level. If it has a story on the chart, it goes on my watchlist. If it does not, it gets cut.
I also go through all the indices. Out of the top 40 indices the ones that are moving the best. Ill look inside that sector for individial names that could be uncoverfed gems! This is more valuable for swing traders as you need less liquidity and ATR on swings then day trading.
The day trading universe of stocks with big volume 5m plus and decent ATR 5 dollars plus is less then a 100 stocks! So the universe of stocks to trade for day traders in general is prettyh light. We lower it to 1million for scanning purposes to hunt for more ideas find some gems but ideally if you want size in a trade you need 5million or more.
I can flip through 200 charts in about 20 minutes using the spacebar in TC2000. That speed is something no other platform I have used can match.
Scan 2: The Pre-Market Scan (Run at 8:30-9:00 AM)
The pre-market scan is my second filter before the bell. I run it starting around 8:30 AM, after most companies have released their press releases and earnings reports for the morning.
Here is something most trading educators will not tell you: how much this scan matters depends entirely on what time of year it is.
During earnings season — roughly four to six weeks out of every quarter — the pre-market is full of action. My earnings season trading guide breaks down exactly how to approach these windows. Companies are reporting, stocks are gapping hard on beats and misses, and there is no shortage of high-volume names to trade. In those windows, the pre-market scan might produce half my ideas for the day.
Outside of earnings season? The pre-market scan is much quieter. There are not many genuine gappers on a random Tuesday in July. On those days, the nightly scan and my go-to stocks list do the heavy lifting — I am trading technical setups on stocks already in play, not chasing fresh news movers.
This is an important distinction. I am not a gaps trader. I do not just turn on a scanner, find whatever gapped the most, and fire away. That is a one-dimensional approach. The full system adapts to what the market is giving you. Some days it is a news catalyst. Most days it is a technical setup on a stock you have been watching for a week.
My pre-market scan criteria in TC2000:
- Pre-market volume: minimum 200,000 shares
- Price move: meaningful gap or pre-market range expansion off a catalyst
- Price range: $5 to 500 ( I stink at stocks over 500)
- Catalyst check: earnings, news event, analyst upgrade, FDA decision, or sector catalyst
That last item requires you to actually read the news. A stock moving 8% on earnings is a completely different animal from a stock moving 8% on no news. The catalyst-driven name has a reason to keep moving. The random pre-market mover often fades the moment the bell rings.
I sort results by relative volume and go through the list. One question for each stock: does this have a setup I actually trade? No setup, no trade — regardless of how big the move is pre-market.
Scan 3: Intraday Scans (9:30 AM - 11:00 AM)
Once the market opens, I have two intraday scans running in the background. These are designed to catch names I missed in pre-market, or stocks that develop momentum after the open.
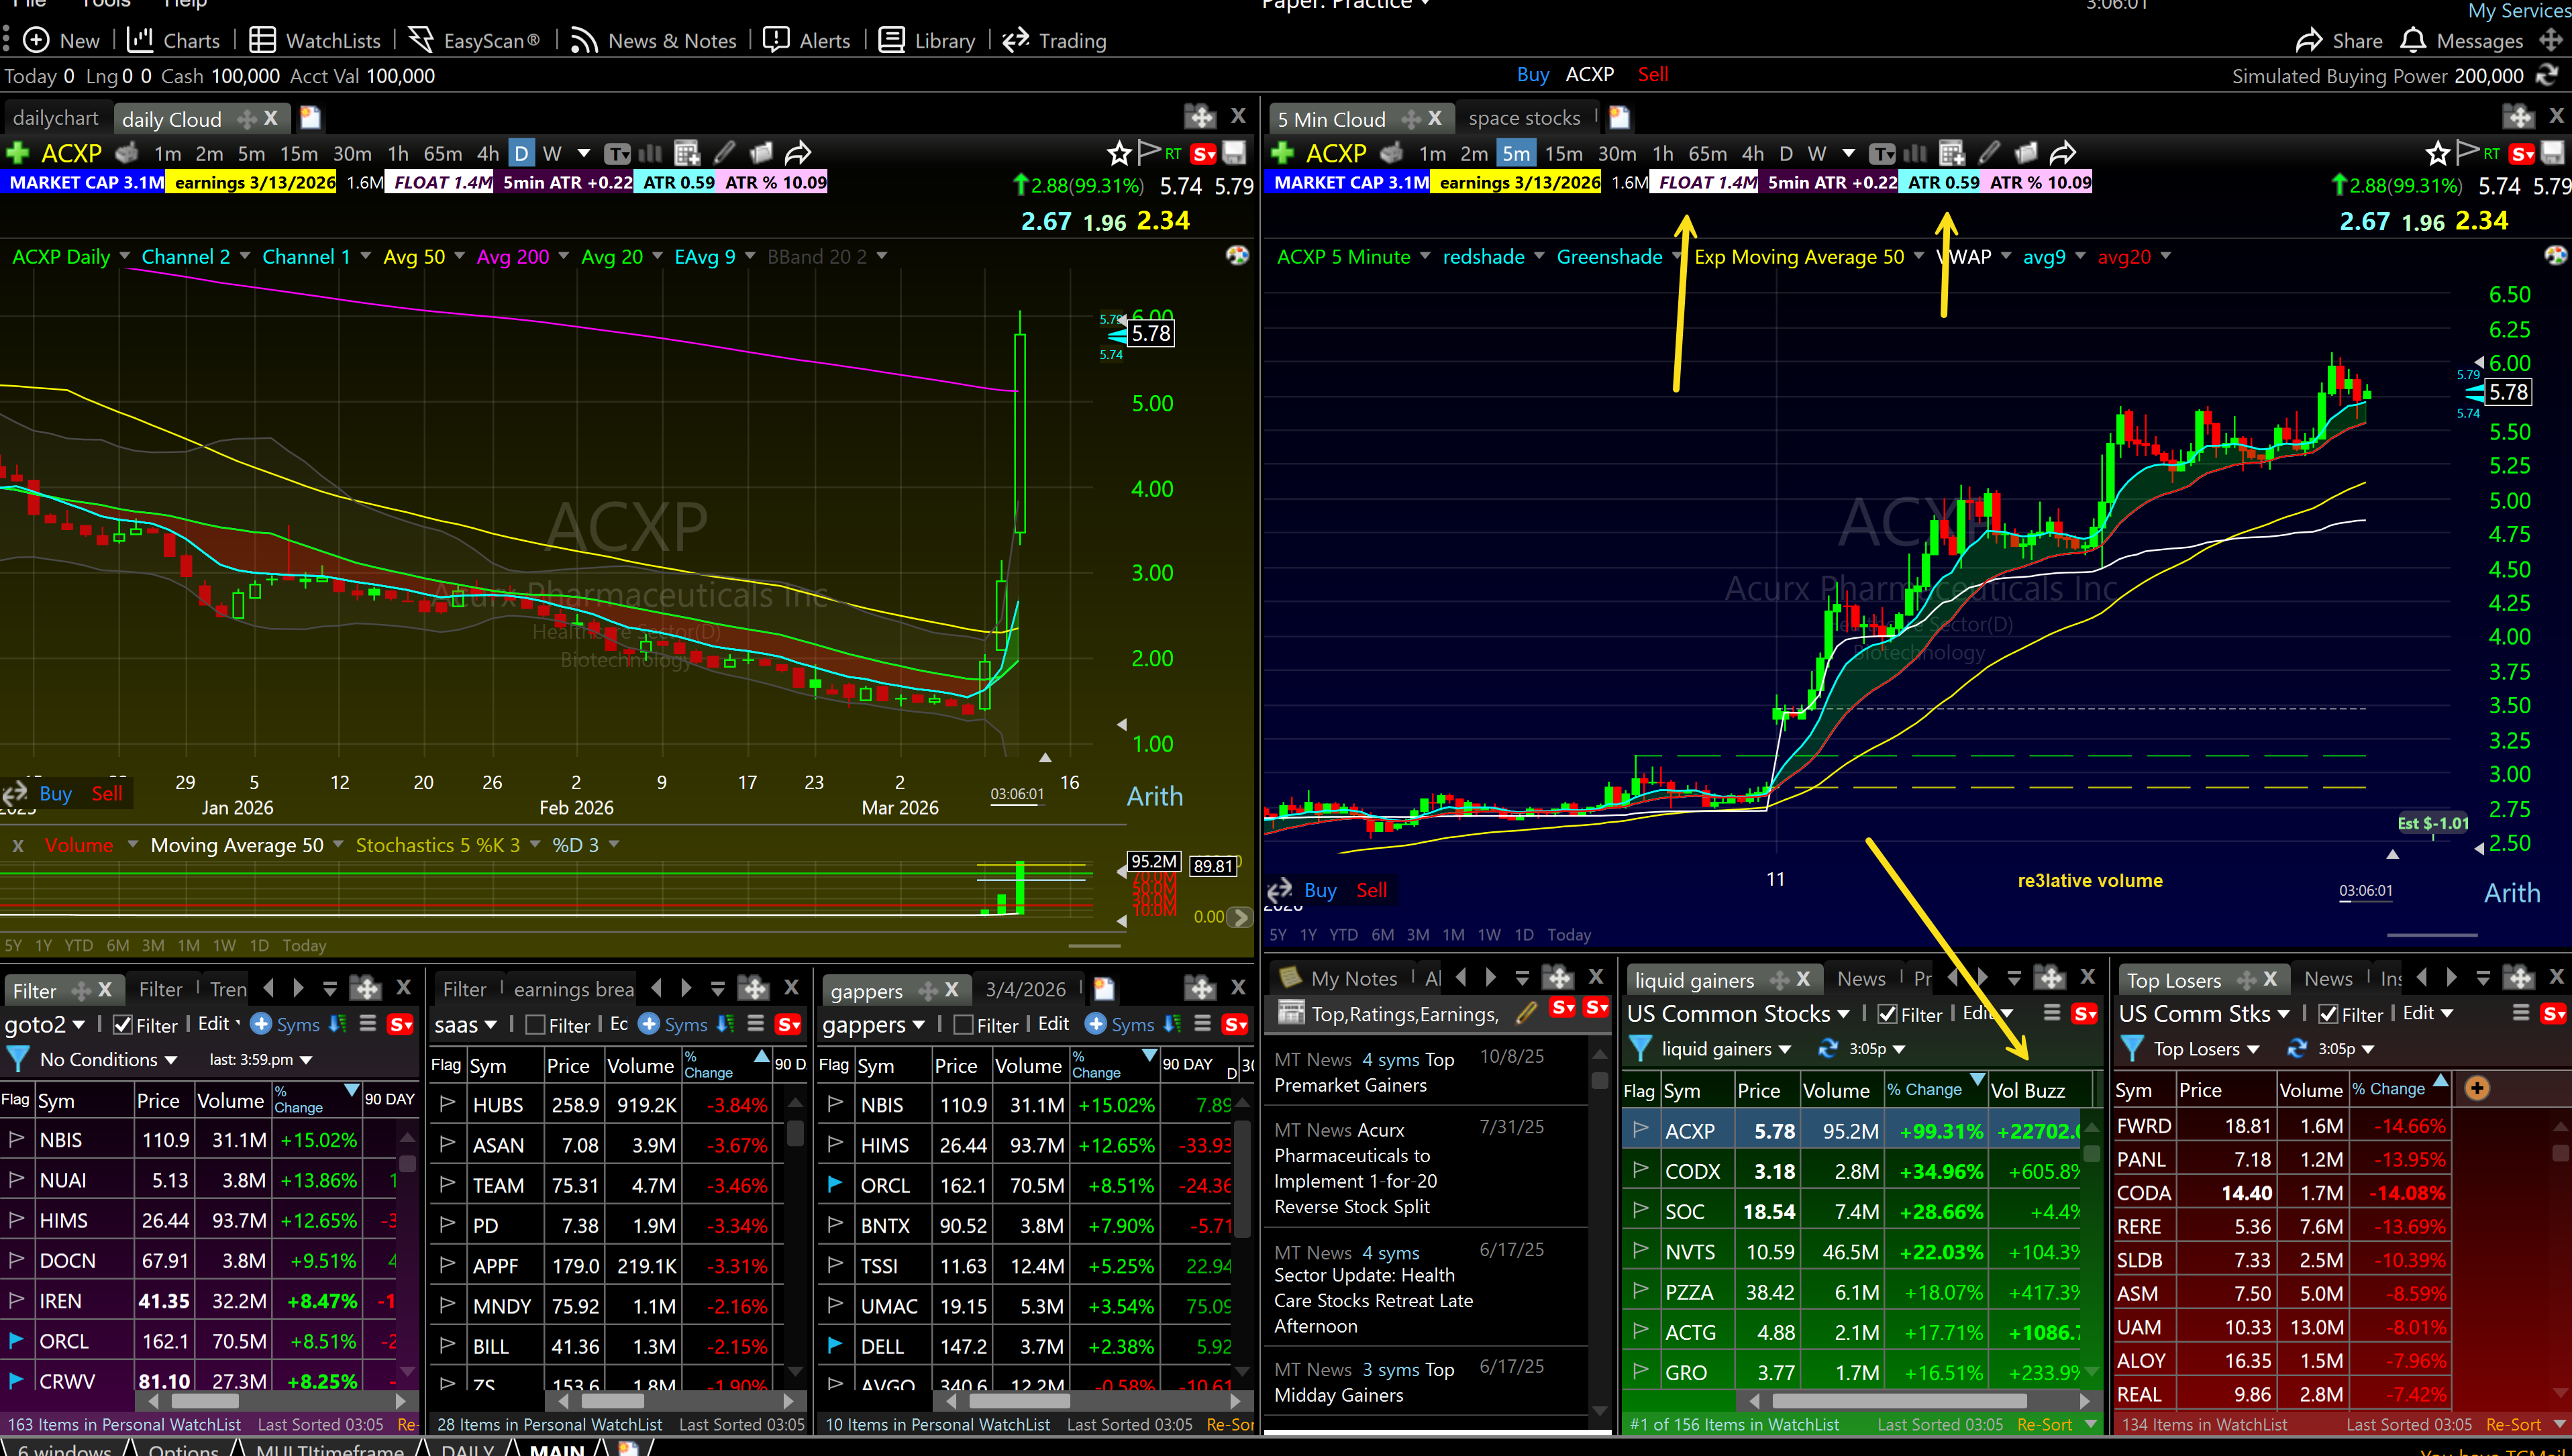
Liquid Gainers Scan:
- Volume: above 1 million shares
- Relative volume: 2x or higher on the current day versus the 30-day average
- Percentage change: up 2% or more from the previous close
High of Day Scanner:
- Stocks within 0.5% of their daily high
- Volume: above 1 million
- Price: $5 to $500
The high of day scanner finds stocks pressing into new highs with volume behind them — exactly the environment where my opening range breakout and first pullback setups show up. When a stock keeps pushing to new highs on heavy volume, that is the market telling you something is happening.
I stop actively scanning after 11:00 AM. The best setups are in the first 90 minutes. After that, the action slows down, volume dries up, and the risk-to-reward on new entries drops significantly.
The Exact Filter Criteria That Matter
Let me be specific about each filter and why it is there.
Relative Volume ( Important Filter)
Relative volume is not the same as raw volume. A stock that normally trades 500,000 shares and does 3 million in one day has a relative volume of 6x. That is extraordinary. A stock that normally trades 5 million shares and does 6 million has a relative volume of 1.2x. That is barely above average.
The number that matters is the ratio, not the raw figure. I want to see 2x or higher on any stock I trade. Below that, I am skeptical. Below 1.5x, I am not interested at all.
High relative volume tells me other traders are paying attention to this stock. It means there is a reason to be in it. Without volume expansion, price movement is weak — breakouts fail, pullbacks do not hold, and you get chopped up.
In TC2000, you can sort any watchlist by relative volume in real-time. On a volatile morning, I sort my pre-market scan results by relative volume and work from the top down.
Float
Float is the number of shares available for trading in the open market. Low float stocks — under 30 million shares — are the most explosive — and when they run on volume, they can go parabolic. Here is why: when a large buyer steps in on a low float stock, they are chasing a limited supply. That pushes price up fast.
Compare that to a stock with a 2 billion share float. Even a massive order barely moves the needle.
For day trading momentum setups, I prefer floats under 500 million. Under 100 million is even better for the biggest intraday moves. But the float has to come with volume — a low float stock with no volume is just illiquid, not explosive.
Price Range
I filter for stocks between $5 and $500. Anything under $5 is often a penny stock with sketchy fundamentals, wild spreads, and manipulation risk. Anything over $500 usually has big spreads for me!
The sweet spot is $10 to $80. Most of my best day trades over the past 25 years have come from names in that range. Those stocks transitioning from the teenagers to adults are the best traders that 18 dollar stock that becomes 40 then 80 in a year those have the best range and volume crossover.
Percentage Change
For longs, I want to see at least 3% change from the previous close in pre-market. That tells me there is news, earnings, or sector momentum driving the move. For small caps with lower floats, I push that to 10% or more — because 3% on a $8 stock is not enough to create the ATR I need for a meaningful trade.
For short setups, I flip the criteria: down 3% or more, with the same volume and float requirements.
My Go-To Stocks List
Beyond daily scanning, I maintain a personal watch list of 100+ stocks I have traded before and made money on. I call this my go-to stocks list.
These are names I know. I understand how they move, what their ATR typically is, how they react to news. When one of them shows up in my scanner, I can move faster because I already have context.
I prune this list quarterly. I remove names I have not traded well, add new names that have been consistently moving, and make sure nothing on the list has fundamentally changed (split, offering, company news that altered the volatility profile).
Right now my list includes names like PLTR, NVDA, AAOI, AXTI, RKLB, ASTS — all names with consistent daily ATR, high liquidity, and chart setups that repeat cleanly. Yours will look different depending on what you trade well.
How to Use Market Breadth to Filter Your Scans
Every morning before I scan individual stocks, I spend 5 minutes on market breadth. This is the top-down check that tells me what kind of day to expect.
I track 40 market indexes in TC2000, sorted by 5-day performance. Which sectors are leading? Which are weak? On a day when semiconductors are up 3% and energy is up 2%, I am looking for setups in those sectors first. I am not going to fight the tape by trading a weak retail name when the market is in full risk-on mode.
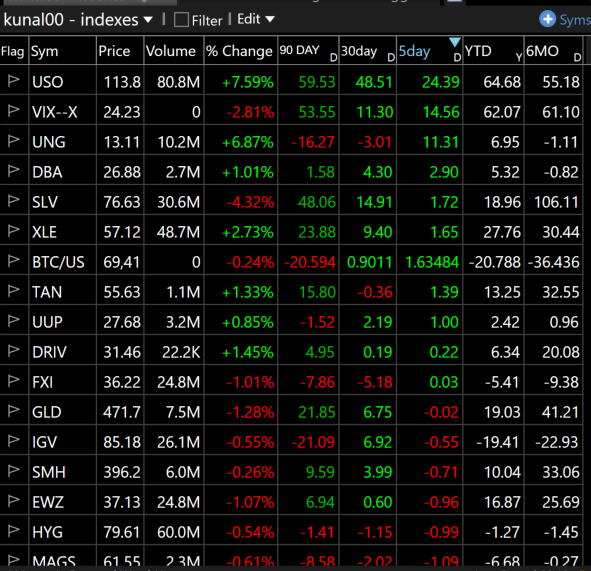
The two metrics I check every morning:
- What are the indices doing
- How many breakouts are we seeing premarket
When both numbers are strong, I size up and trade aggressively. When both are weak, I shrink my size and trade defensively — or I do not trade at all. The market conditions filter is one of the most underused tools in a day trader's arsenal. According to FINRA's investor education resources, a significant percentage of active day traders underperform precisely because they trade the same size regardless of conditions.
How I Use Alerts So I Am Not Staring at Charts All Day
I set alerts in TC2000 on every name on my watchlist. Price alerts, trendline alerts, moving average alerts. When the alert fires, I look at the stock. Until then, I am not watching it.
This is important. Staring at a chart for three hours waiting for a setup is one of the fastest ways to overtrade. You start seeing patterns that are not there. You convince yourself a sloppy setup is worth taking. You take a trade out of boredom.
Alerts eliminate that problem. I can have 50 stocks on my radar, but I am only actively watching the 5 to 10 that actually triggered something meaningful.
In TC2000, I set trendline alerts by drawing a trendline at the resistance level I am watching, right-clicking, and adding an alert. When price touches that line, my phone buzzes. I look at the chart. If the setup is clean, I trade it. If it is sloppy, I ignore it and move on.
This workflow lets me review the market in the morning, set my alerts, and then focus on execution from 9:30 to 11:00 AM without constantly hunting for new ideas mid-session.
The Complete Workflow: From Scan to Setup
Here is how it actually works in practice — and where most traders get confused.
A gap is not a trade. A gap is a reason to look.
When a stock shows up on my scanner with a big move and explosive relative volume, that tells me there is energy in it. News, earnings, a catalyst — something woke this stock up. But I do not just buy it because it gapped. That is not trading, that is gambling.
The workflow is: Now this is the workflow for how to trade an earnings or press release. I use different workflows for different setups.
Step 1 — Scan. Find the stocks with relative volume expansion and a real catalyst behind the move.
Step 2 — Look left. Always look left on the chart. Where is the stock relative to its recent range? Is it clearing into open space with no resistance above? That is a powerful setup. Is it gapping into a wall of supply from three months ago? That is a problem. The gap has to be clearing ranges — breaking into clean air — or the probability drops significantly.
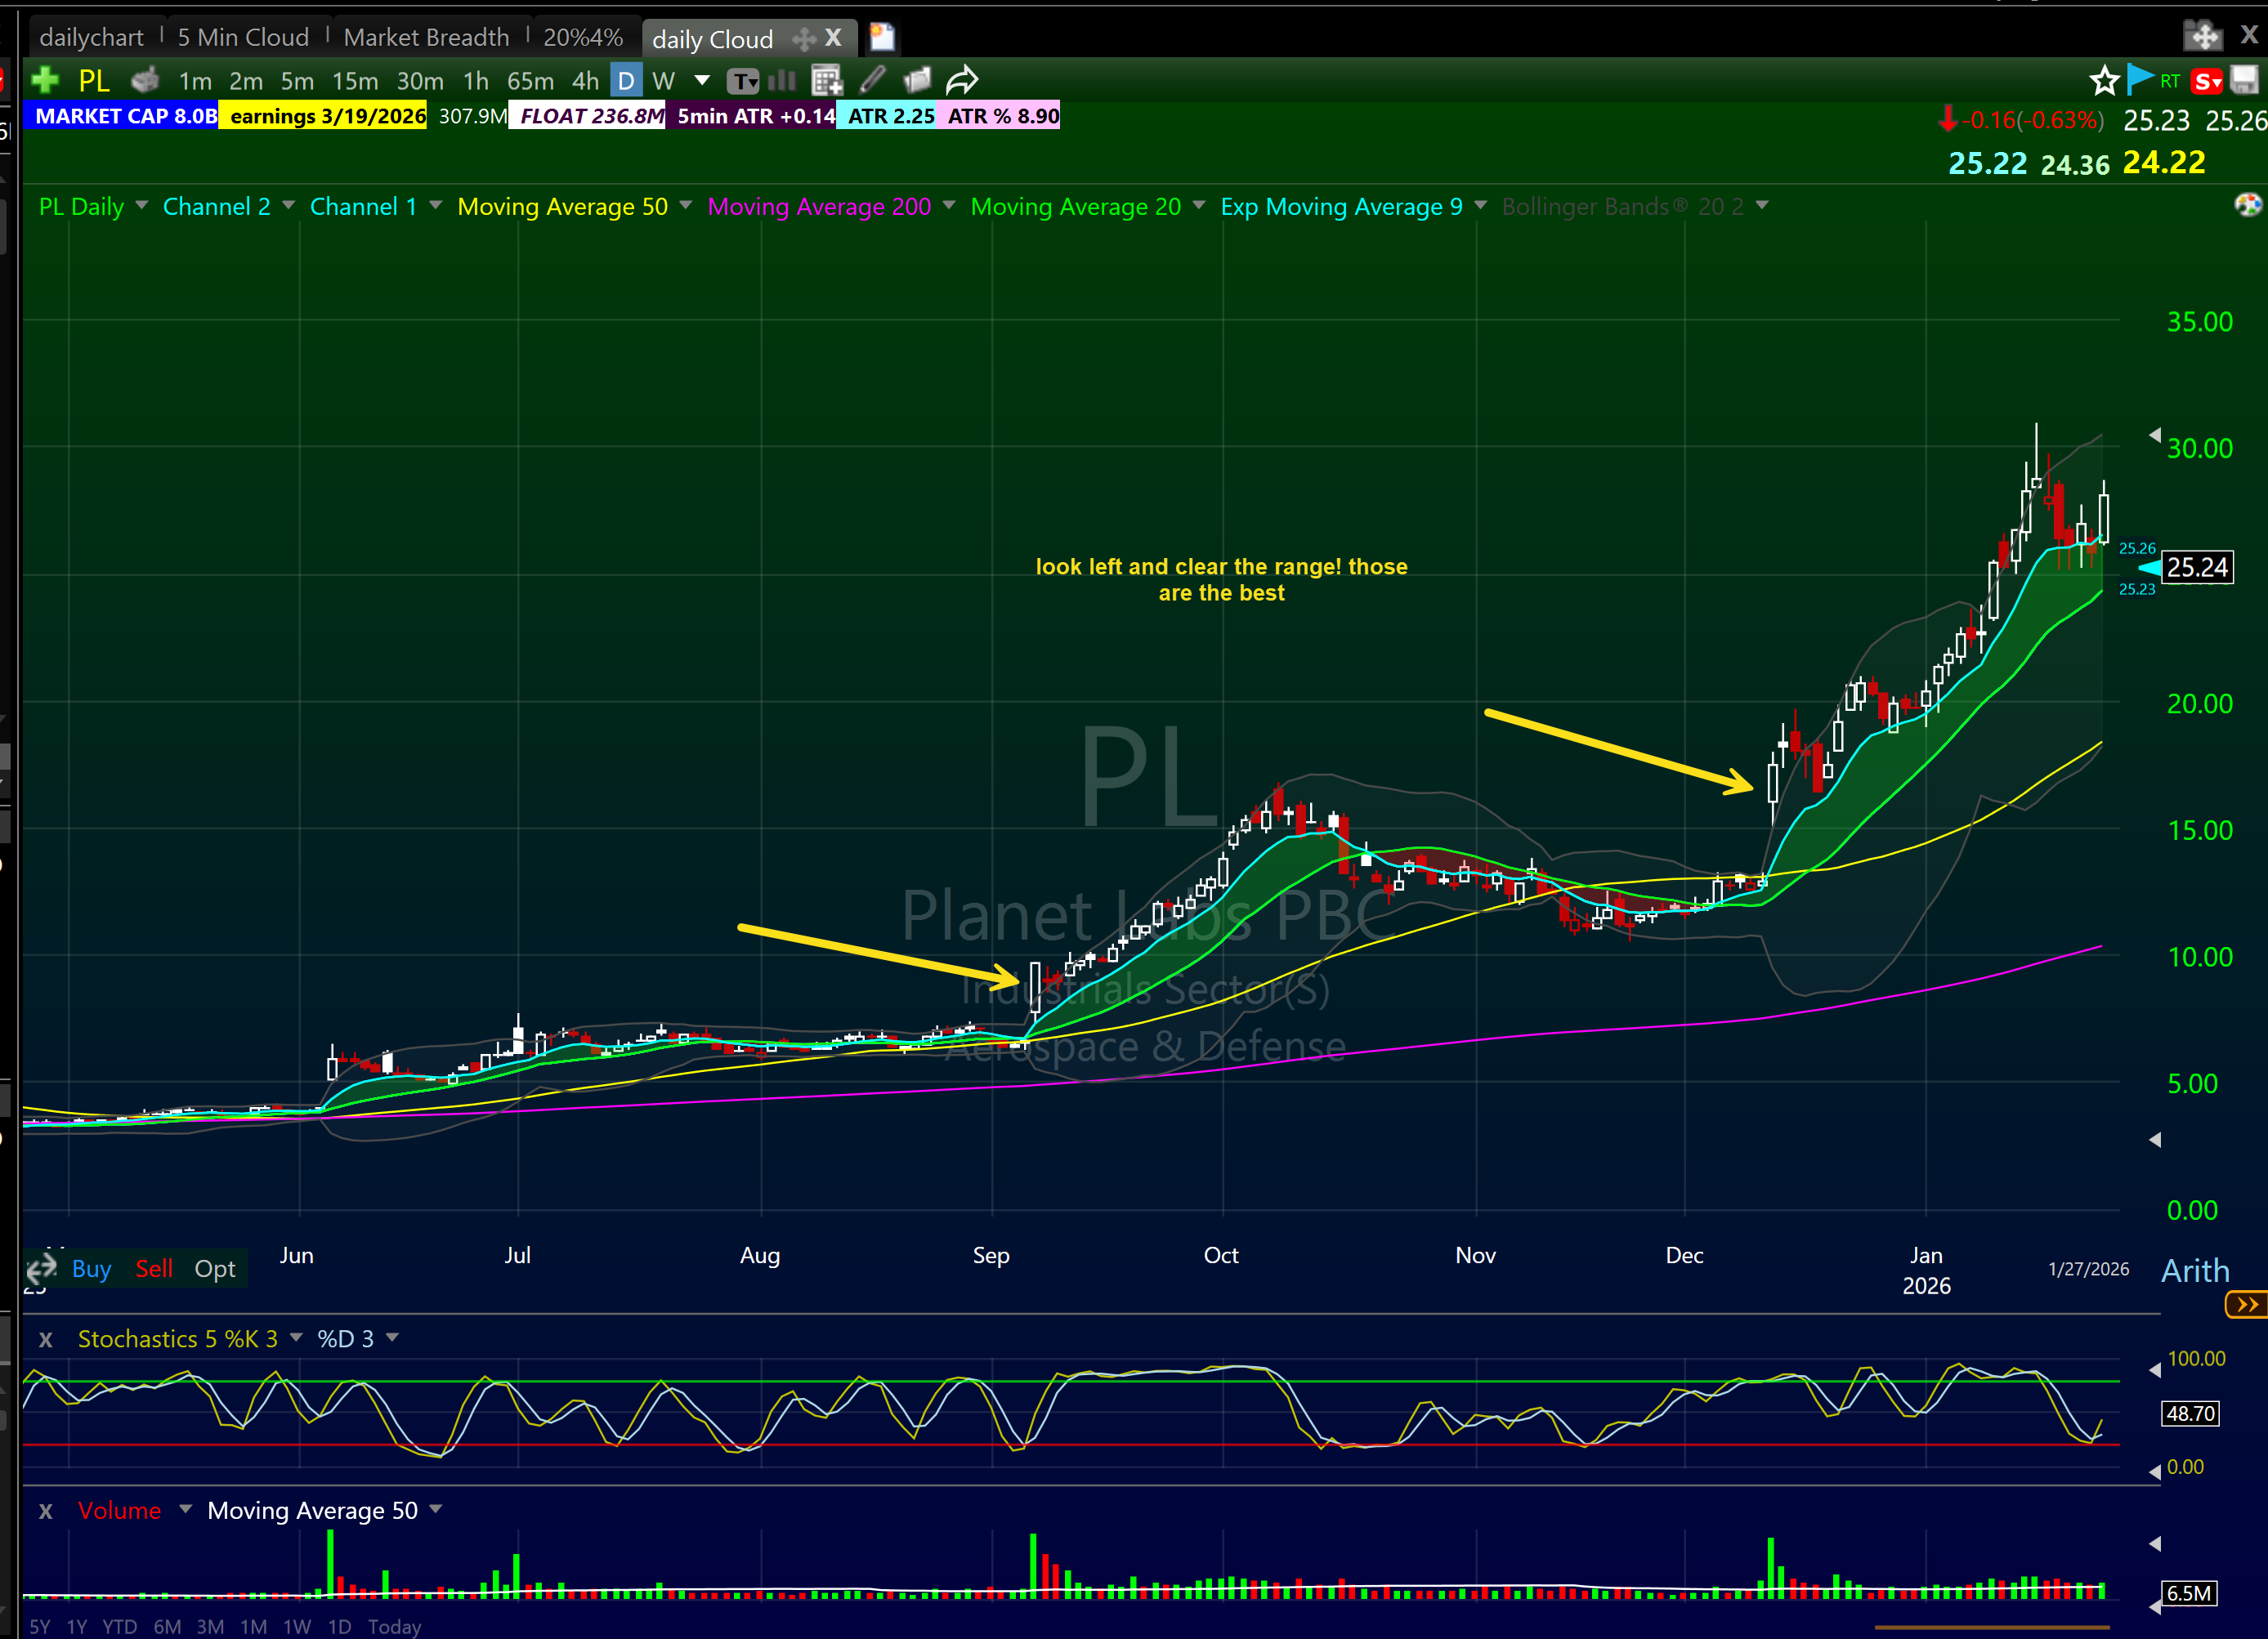
Step 3 — Find your pattern. The gap got the stock on my radar. Now I need a pattern to trade. One of my core setups has to be present or I do not take the trade. No pattern, no trade. Period.
The patterns I am looking for on a gapping stock:
- Opening Range Breakout (ORB): Stock gaps up, consolidates in a tight range for the first 15 to 60 minutes, then breaks out of that range on volume. The tighter the consolidation, the better the trade. See the full breakdown in my opening range break guide.
- First Pullback Buy: After the initial move off the gap, the stock pulls back to the 9 EMA or into the Bone Zone — the area between the 9 and 20 EMA on the 5-minute chart. Volume dries up on the pullback, a green candle holds the EMA, and that is the entry. This is often the cleanest trade of the day on a gapping momentum stock. Full breakdown at my first pullback strategy guide.
- Red to Green: Stock opens below the previous day's close, dips into the red, then crosses back above that level on volume. The previous close is the line in the sand. When it crosses back green with conviction, that is the entry. HIMS on March 11, 2026 was a perfect example — exactly what I traded and exactly how it worked.
- VWAP Bounce: Stock gaps up, runs hard early, then pulls back to VWAP. A green candle holds at or just above VWAP and the stock resumes. The deeper context is in my VWAP indicator guide.
The gap is the context. The pattern is the trade. Never confuse the two.
This is what separates a complete trading system from a one-trick approach. Plenty of traders just turn on a scanner and fire at whatever gapped the most. They have no pattern criteria, no look-left discipline, no setup filter. They are reacting to the number, not trading the chart. That is exactly the kind of trading that produces inconsistent results regardless of how good your scanner is.
Applying Scans to My Actual Day Trading Setups
A scan does not tell you what to trade. It tells you where to look. Once a stock makes my list, I am evaluating it against the setups I actually trade. Here is how scanning feeds directly into my execution.
Opening Range Breakout (ORB)
The ORB is one of my primary day trading setups. A stock spikes at the open, consolidates in a tight range for 15 to 60 minutes, then breaks out of that range with volume. The pre-market gappers scan is where I find the candidates for this. I am looking for stocks that gapped up on news, are holding near their pre-market high, and show tight consolidation after the open.
The filter here is tightness. A loose ORB — where the stock is flopping around in a wide range — is a lazy trade. I want the consolidation range to be tight relative to the ATR of the stock. If the ATR is $2 and the opening consolidation is $0.25 wide, that is the kind of ORB worth trading. For a full breakdown of the ORB setup, see my guide to the opening range break pattern.

First Pullback Buy
After a strong morning move, a stock will often pull back to the 9 EMA or into the Bone Zone — the area between the 9 EMA and 20 EMA on the 5-minute chart. That pullback is the entry I want for the first pullback setup.
The intraday scan feeds this. Once I see a name holding its morning high on decreasing volume, I watch for it to pull back. When the pullback comes in on light volume and a green candle holds at the 9 EMA, that is my entry. More on this setup at my first pullback trading strategy guide.
VWAP Setups
VWAP is the volume-weighted average price — it represents the true average cost of all shares traded so far that day. When a trending stock pulls back to VWAP and holds a green candle, that is a high-probability bounce. The intraday scan helps me find stocks in clean uptrends that are approaching VWAP for the first time after a morning move.
See the full breakdown at my VWAP indicator guide.
What to Do With Scan Results
You have your list. Now what?
Step one: flip through every chart. Use the spacebar in TC2000. Move fast. You are not studying each chart for 10 minutes — you are pattern-recognizing at speed. Does this have a setup I can name? If yes, keep it. If no, skip.
Step two: rank your list by conviction. Use my candlestick chart patterns guide to sharpen your chart reading. Not every name is equal. Some have a clean setup plus a strong catalyst plus sector tailwind. Those are your A+ trades. Others have one thing going for them. Those are backup candidates.
Step three: set alerts on every name you keep. Do not stare at charts — let the platform work for you.
Step four: at 9:30, focus on your top 3 to 5 names. Do not try to track 15 stocks at once in the first 30 minutes. The market open is chaotic. Stay focused.
The SEC's guidance for retail investors is worth keeping in mind here — day trading requires a disciplined system, not reactive decision-making. The scanner is not what makes you money. Execution discipline is.
Common Scanning Mistakes I See From Students
After training over 7,000 students at Bulls on Wall Street, I have seen the same scanning mistakes over and over.
Tracking too many stocks. If your watchlist has 40 names on it, you have no watchlist. You have noise. Cut it to 5 to 10.
Ignoring relative volume. Raw volume numbers without context are meaningless. A stock doing 2 million shares means nothing if it averages 10 million.
Taking every scan result at face value. The scanner gives you a list. You still have to look at the chart. A stock can pass all your filters and still have a terrible setup.
Scanning without a market context check. Running your same scan criteria on a distribution day is a mistake. When the market is selling off hard, your long scan results are mostly traps.
Never pruning the go-to list. Your go-to stocks from 2021 may not be the right names for 2025. Markets rotate. Hot sectors change. Keep your list current.
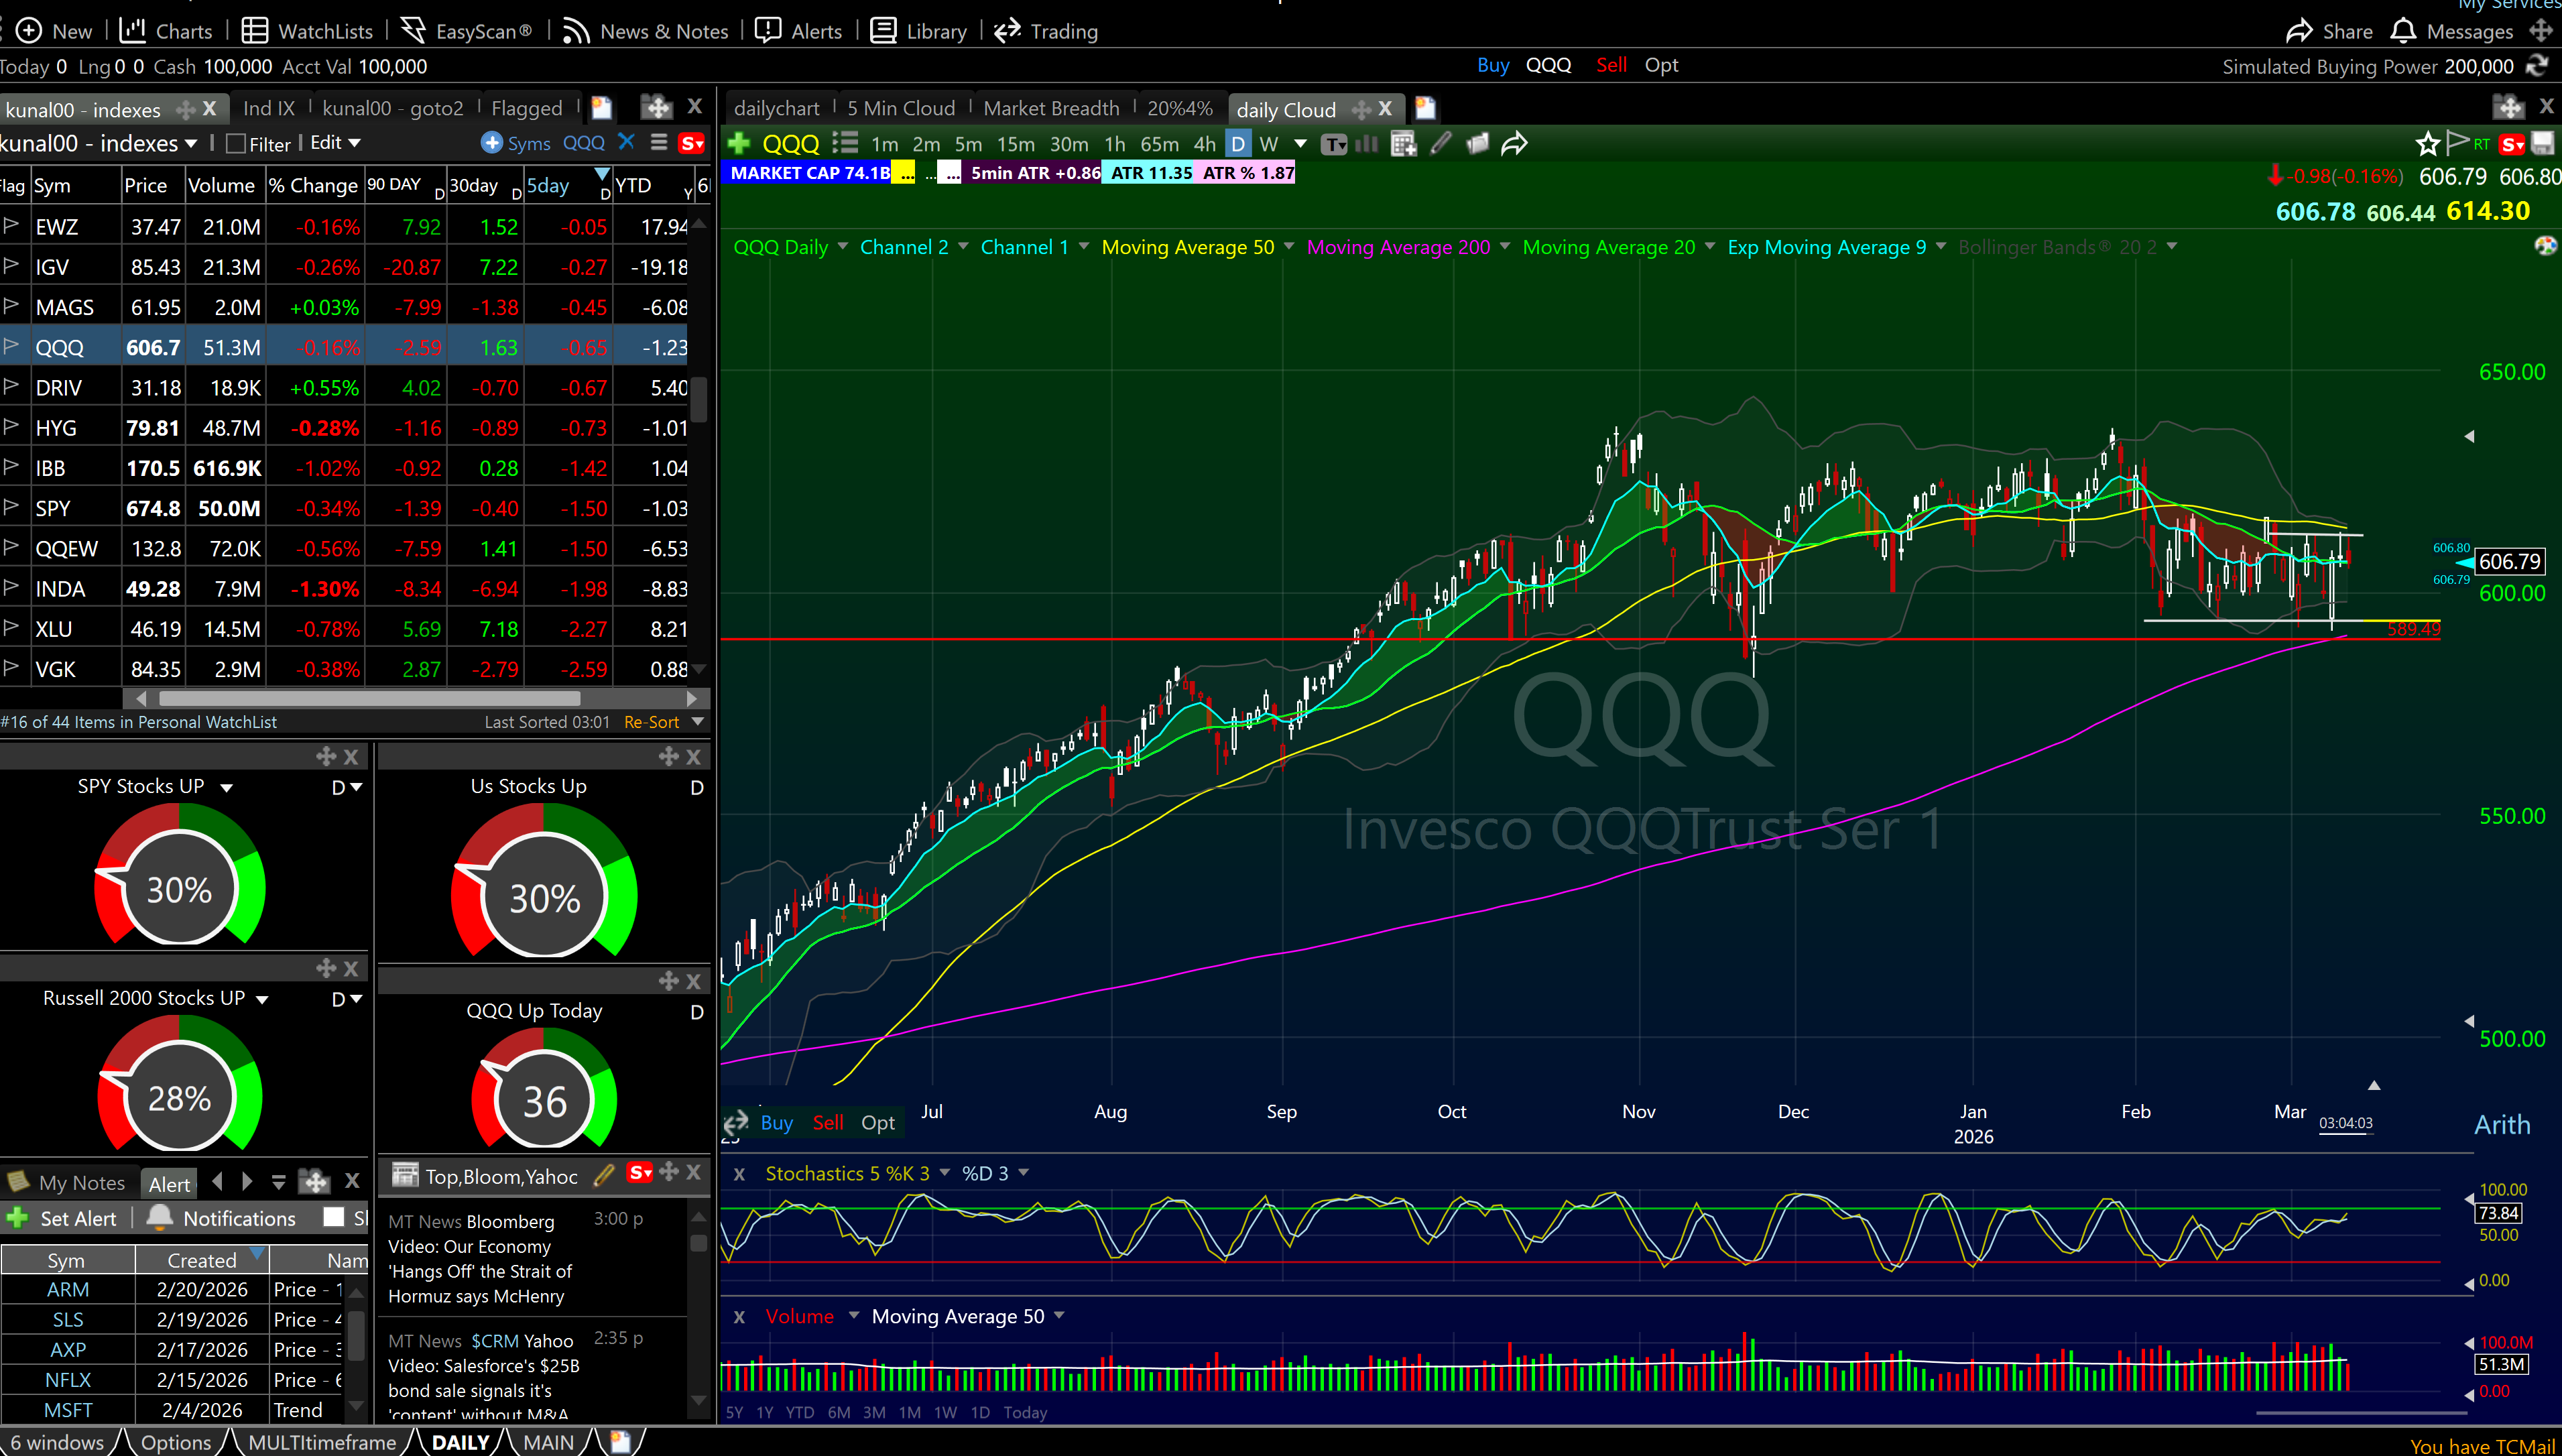
The TC2000 Layout I Use Every Day
My TC2000 layout is built around the scanning workflow. On the left side, I have my 40 market indexes sorted by 5-day performance and my go-to watchlist. On the right side I have a daily chart. I also keep tabs on that chart so i can take a look at market breadth, 4% breakouts and other chart layouts in case i want a different view.
During market hours I expand to a 6-window layout with my top momentum names running simultaneously in 5-minute charts. QQQ stays visible at all times so I always have market context.
This setup lets me scan, identify, alert, and execute without switching platforms or hunting for data. It is all in one place, which is why I have never left TC2000 in over 20 years of trading. Use the Bulls referral link to get the best available pricing.
Research from the Journal of Financial Economics consistently shows that traders with defined, systematic approaches to stock selection significantly outperform those who react to news and tips. The scanner is the system. Use it every day without exception.
FAQ: How to Scan for Stocks to Day Trade
What is a stock scanner and why do day traders need one? A stock scanner filters thousands of stocks down to a manageable list based on criteria you define — volume, price, relative volume, float, and more. Day traders need one because there are over 5,000 stocks trading every day and you cannot manually review them all. A scanner does the filtering so you can focus on execution.
What is the most important scanner filter for day trading? Relative volume. It tells you how today's trading activity compares to the stock's normal level. High relative volume means the stock is getting unusual attention — which is what creates the volatility day traders need.
What is the best scanning tool for day trading? I use TC2000 and have for over 20 years. The EasyScan tool runs 2-second real-time scans with fully customizable criteria — no coding required. It is the fastest and most reliable scanner I have used.
How many stocks should be on my day trading watchlist? 5 to 15 maximum. More than that and you lose focus. I typically go into the open with 5 to 8 names and take trades from my top 3 to 5. Quality over quantity every time.
When should I run my scans? Three times: nightly (after 8 PM), pre-market (8:30-9:00 AM), and intraday (9:30-11:00 AM). The nightly and pre-market scans build your watchlist. The intraday scan catches names you missed.
What float size should I look for in day trading? Under 100 million shares for most plays. Under 30 million for the most explosive small-cap moves. Low float means less supply, which amplifies price movement when volume spikes.
Does the pre-market scan matter more during earnings season? Significantly. During earnings season — roughly four to six weeks per quarter — there are genuine catalysts driving pre-market moves and the scan produces more actionable names. Outside of earnings season, the pre-market is quieter and your nightly scan and go-to stocks list carry more weight. The system adapts to what the market is giving you.
What is the difference between a pre-market scan and an intraday scan? Pre-market scans identify stocks moving before the bell — they are your primary watchlist for the day. Intraday scans run during market hours to catch names developing momentum after the open that you may have missed.
How do you filter out bad scan results? By looking at the chart. The scanner gets you a list. You still have to evaluate the setup on each chart. If there is no named pattern — no ORB forming, no pullback to a key EMA, no clean consolidation — the stock does not make the cut regardless of the numbers.
Should beginners use the same scan criteria as experienced traders? Start with the basics: relative volume 2x+, price $5-$150, volume 1M+. If you are completely new to trading, my guide for newbie day traders covers the foundation you need before scanning matters. As you develop your edge and learn which setups you trade best, add more specific criteria. Do not over-engineer the scan before you have experience executing setups.
How does market breadth affect my scanning?It sets the context. When the market is in a strong uptrend with the majority of stocks above their 40-day moving average, I trust my long scan results. When breadth is poor, I treat even clean-looking setups with more skepticism and size down.
Can I use these scans for swing trading too? The nightly scan applies directly to swing trading — I am looking at daily chart setups using many of the same criteria. Swing trading relies more on the daily chart pattern than intraday momentum. See my swing trading page for how I approach that side of the business.
Build Your Scanning Routine Today
Scanning is not a one-time setup. It is a daily discipline. The traders who are consistently profitable are running their scans every single night and every single morning without exception. It takes 20 minutes nightly and 30 minutes pre-market. That is the cost of having a real edge.
If you want to learn how I build watchlists, execute setups, and manage risk in real-time — this is exactly what we cover in the 60-Day Live Trading Bootcamp. You are not just watching recorded videos. You are trading live alongside me, using TC2000, running the same scans, and executing the same setups I have used for over 25 years. We have trained 7,000+ students and built this curriculum from real data on what actually works.
Start with TC2000, get your layout built, and run the scans every day. The market rewards preparation. Everything else is just noise.
Check out my day trading page for more on the setups I trade, my risk management guide for how I size positions, my pre-trade checklist for what I confirm before every entry. You can also follow my live pre-market analysis on the Bulls on Wall Street YouTube channel every Tuesday and Thursday at 9:00 AM EST.
This scanning system is part of our complete day trading strategies guide covering the setups professional traders use every single day.
About the Author
Written by Kunal Desai, founder and CEO of Bulls on Wall Street. Kunal has been trading professionally since 1999 and went full-time in 2007. Since founding BOWS in 2008, he has trained over 7,000 students through the 60-Day Live Trading Bootcamp. His work has been featured in Forbes, Fortune, and Inc. He trades momentum stocks daily using TC2000 and shares live trade analysis on the Bulls on Wall Street YouTube channel.