

Updated June 2026
It was 2008. Markets were in freefall. I was sitting with my good friend Steve, a guy I had met on Twitter back when Twitter was brand new, and we were trading Chinese stocks together. The market was moving so fast it was almost violent. Steve was showing me how he traded the opening range breakout pattern, primarily to the downside and to the upside on inverse ETFs, because that is what the market was giving us that year. That was the first time I really understood what the ORB pattern could do.
What is funny is that in those early years, the opening range breakout was also the pattern that cost me the most money. Not because the setup does not work. It absolutely does. It cost me because it exposed every bad impulse I had as a trader. I am a little hyperactive. I jump the gun. I would see the first candle forming and convince myself I had seen enough. I would buy on candle 1 or candle 2, the stock would chop and shake me out, and then it would rip exactly the way I had predicted after I was already out. Big loss, missed the move. Painful.
That pattern tested me more than any other. Eighteen years of full-time trading later, it still tests me. This week it took $5,000 from me for breaking my own rule, and I will show you that exact trade below, because the loss teaches the rule better than any winner could.
I kept working on the ORB for one specific reason: lifestyle. If you can pair the ORB with the first pullback setup, you only need to trade from 9:30 to 11:00 AM. Two hours. Get good at them and you have your whole day back.
What Is the Opening Range Breakout?
The opening range breakout is a day trading setup where a stock gaps up on news or a catalyst, consolidates in a tight range during the first few candles after the open, and then breaks out of that range with conviction on volume.

Why I Use the 5-Minute Chart (Not the 1-Minute)
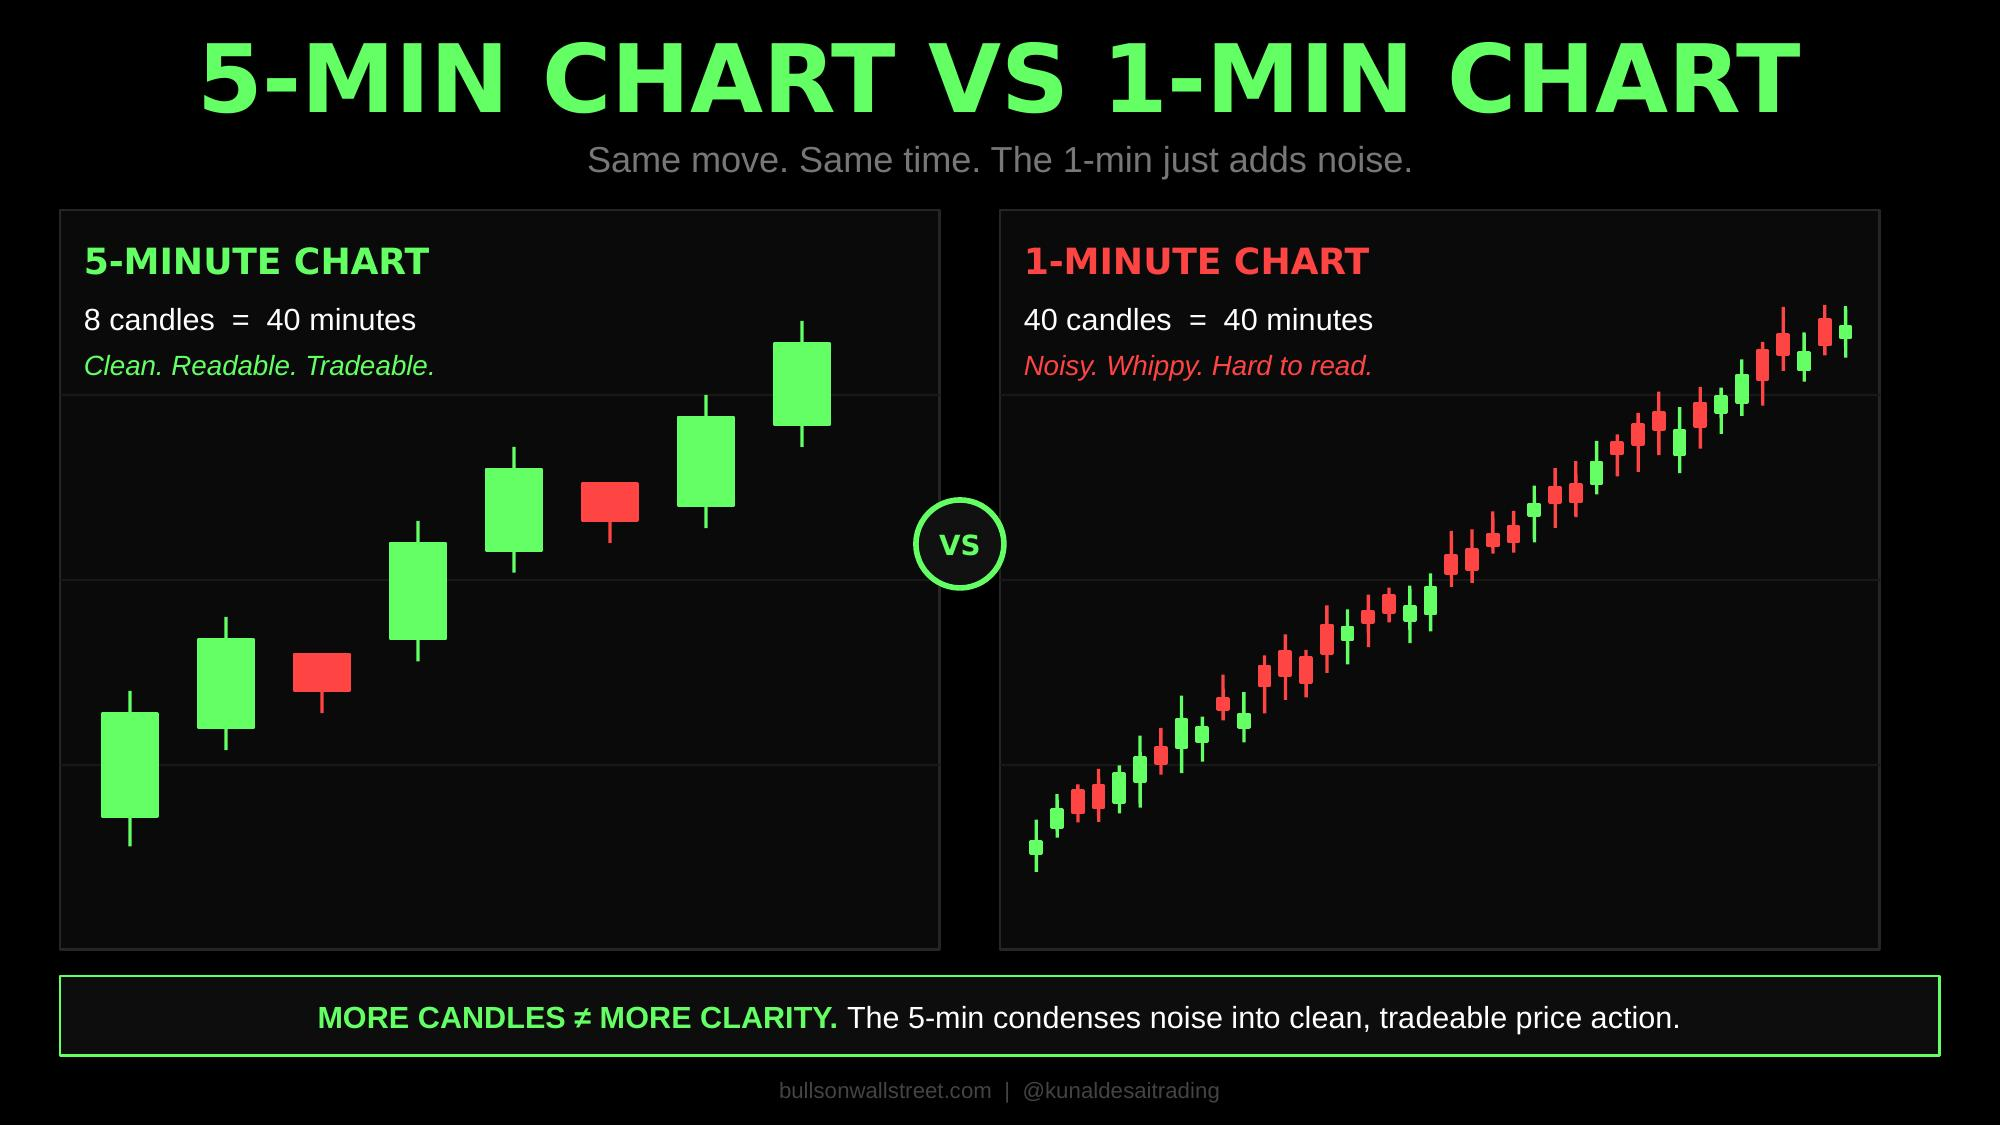
I trade the ORB exclusively on the 5-minute chart. The 1-minute chart is too noisy. False breakouts, wicks, micro-scalping traps. The 15 or 30-minute range is too slow; by the time it forms, the best move is half over.
The 5-minute is the sweet spot. Each candle takes 5 minutes to form. You get enough data to read real price action without the noise. When I sit on a 1-minute chart I end up scalping out of stocks for 5 to 10 cents every time, because I see patterns and signals everywhere. On the 5-minute chart I am far more likely to hold a stock for the bigger move.
The 3-Candle Rule
You need a minimum of 3 candles to form the consolidation range before you consider entering. Candle 1 is pure reaction to the gap. Chaos. Candle 2 starts to settle. Candle 3 is where the range becomes defined. The lid is visible on the chart. When candle 3 breaks above the high of that consolidation, that is your entry. Over 50% of ORBs trigger on the third candle.
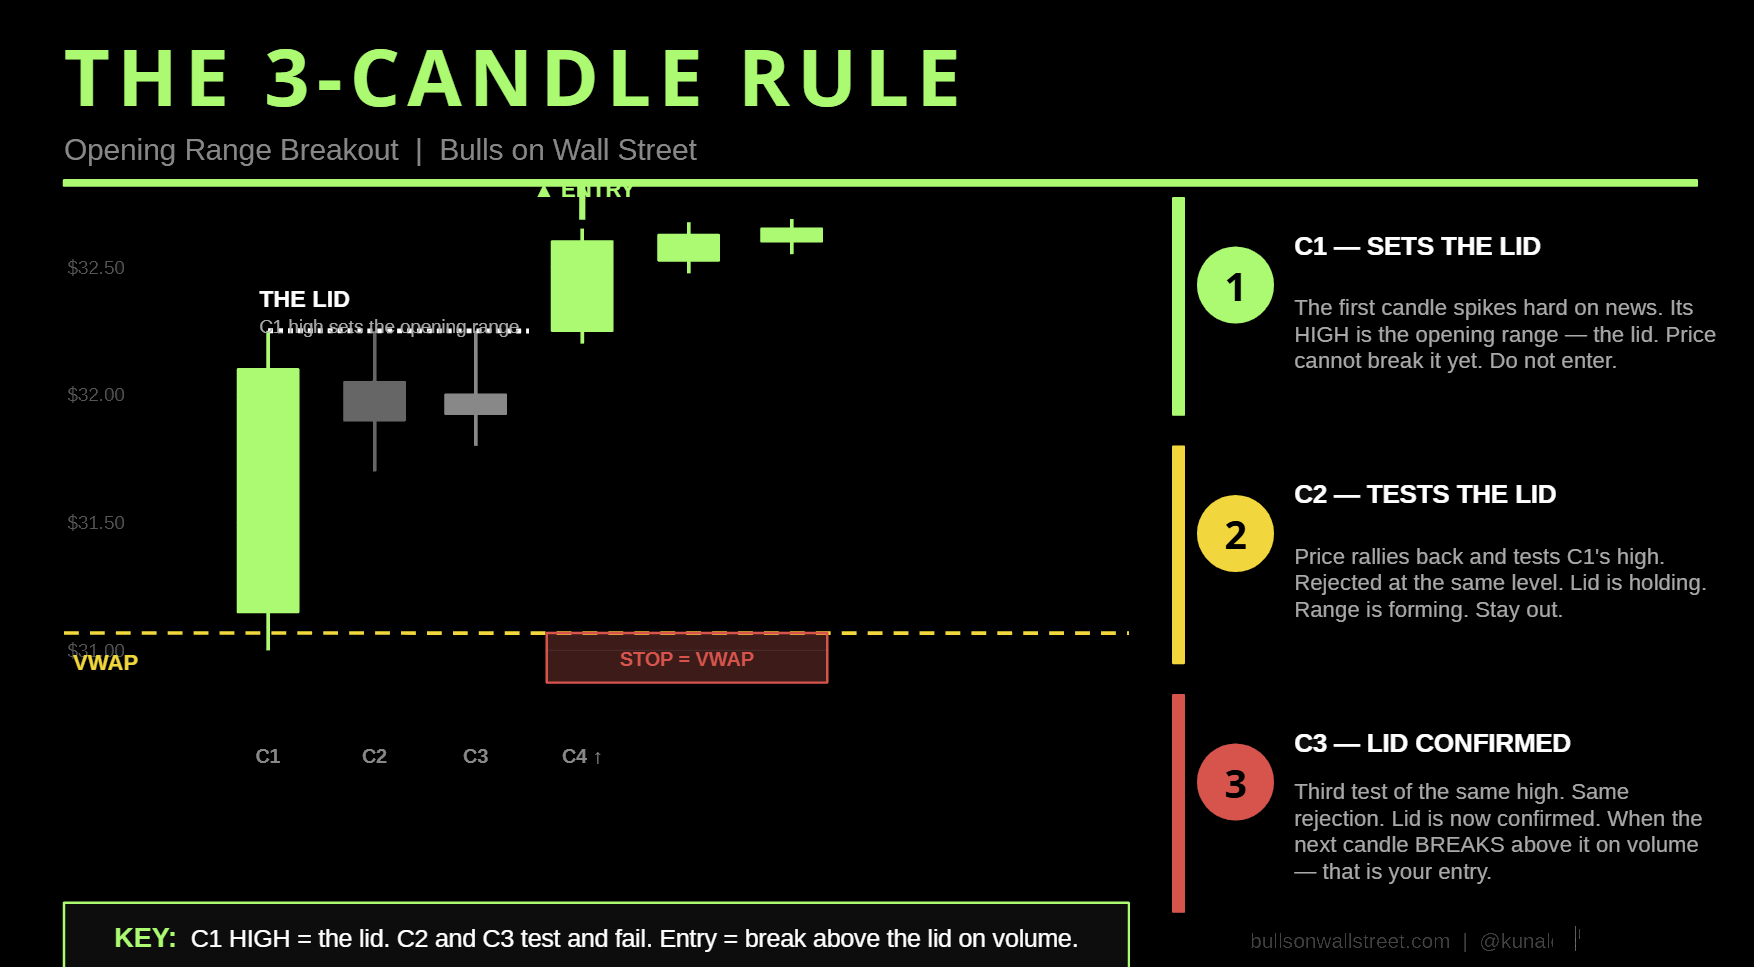
The Lid: What a Clean ORB Looks Like
The consolidation candles after the gap have to be tight and contained. The highs should be similar. The lows should be similar. When you draw a line across the tops of those candles, it should look flat, like a lid sitting on top of the price action, holding it down. When the stock finally breaks through that lid on candle 3 or later, the pressure releases.
A sloppy ORB has wide overlapping candles with no defined range. Skip it. And if you cannot yet read what a tight candle versus a wide sloppy candle is telling you, start with my candlestick patterns PDF before you trade this setup at all.
The $5,000 Lesson: Three Candles Are Not a Range
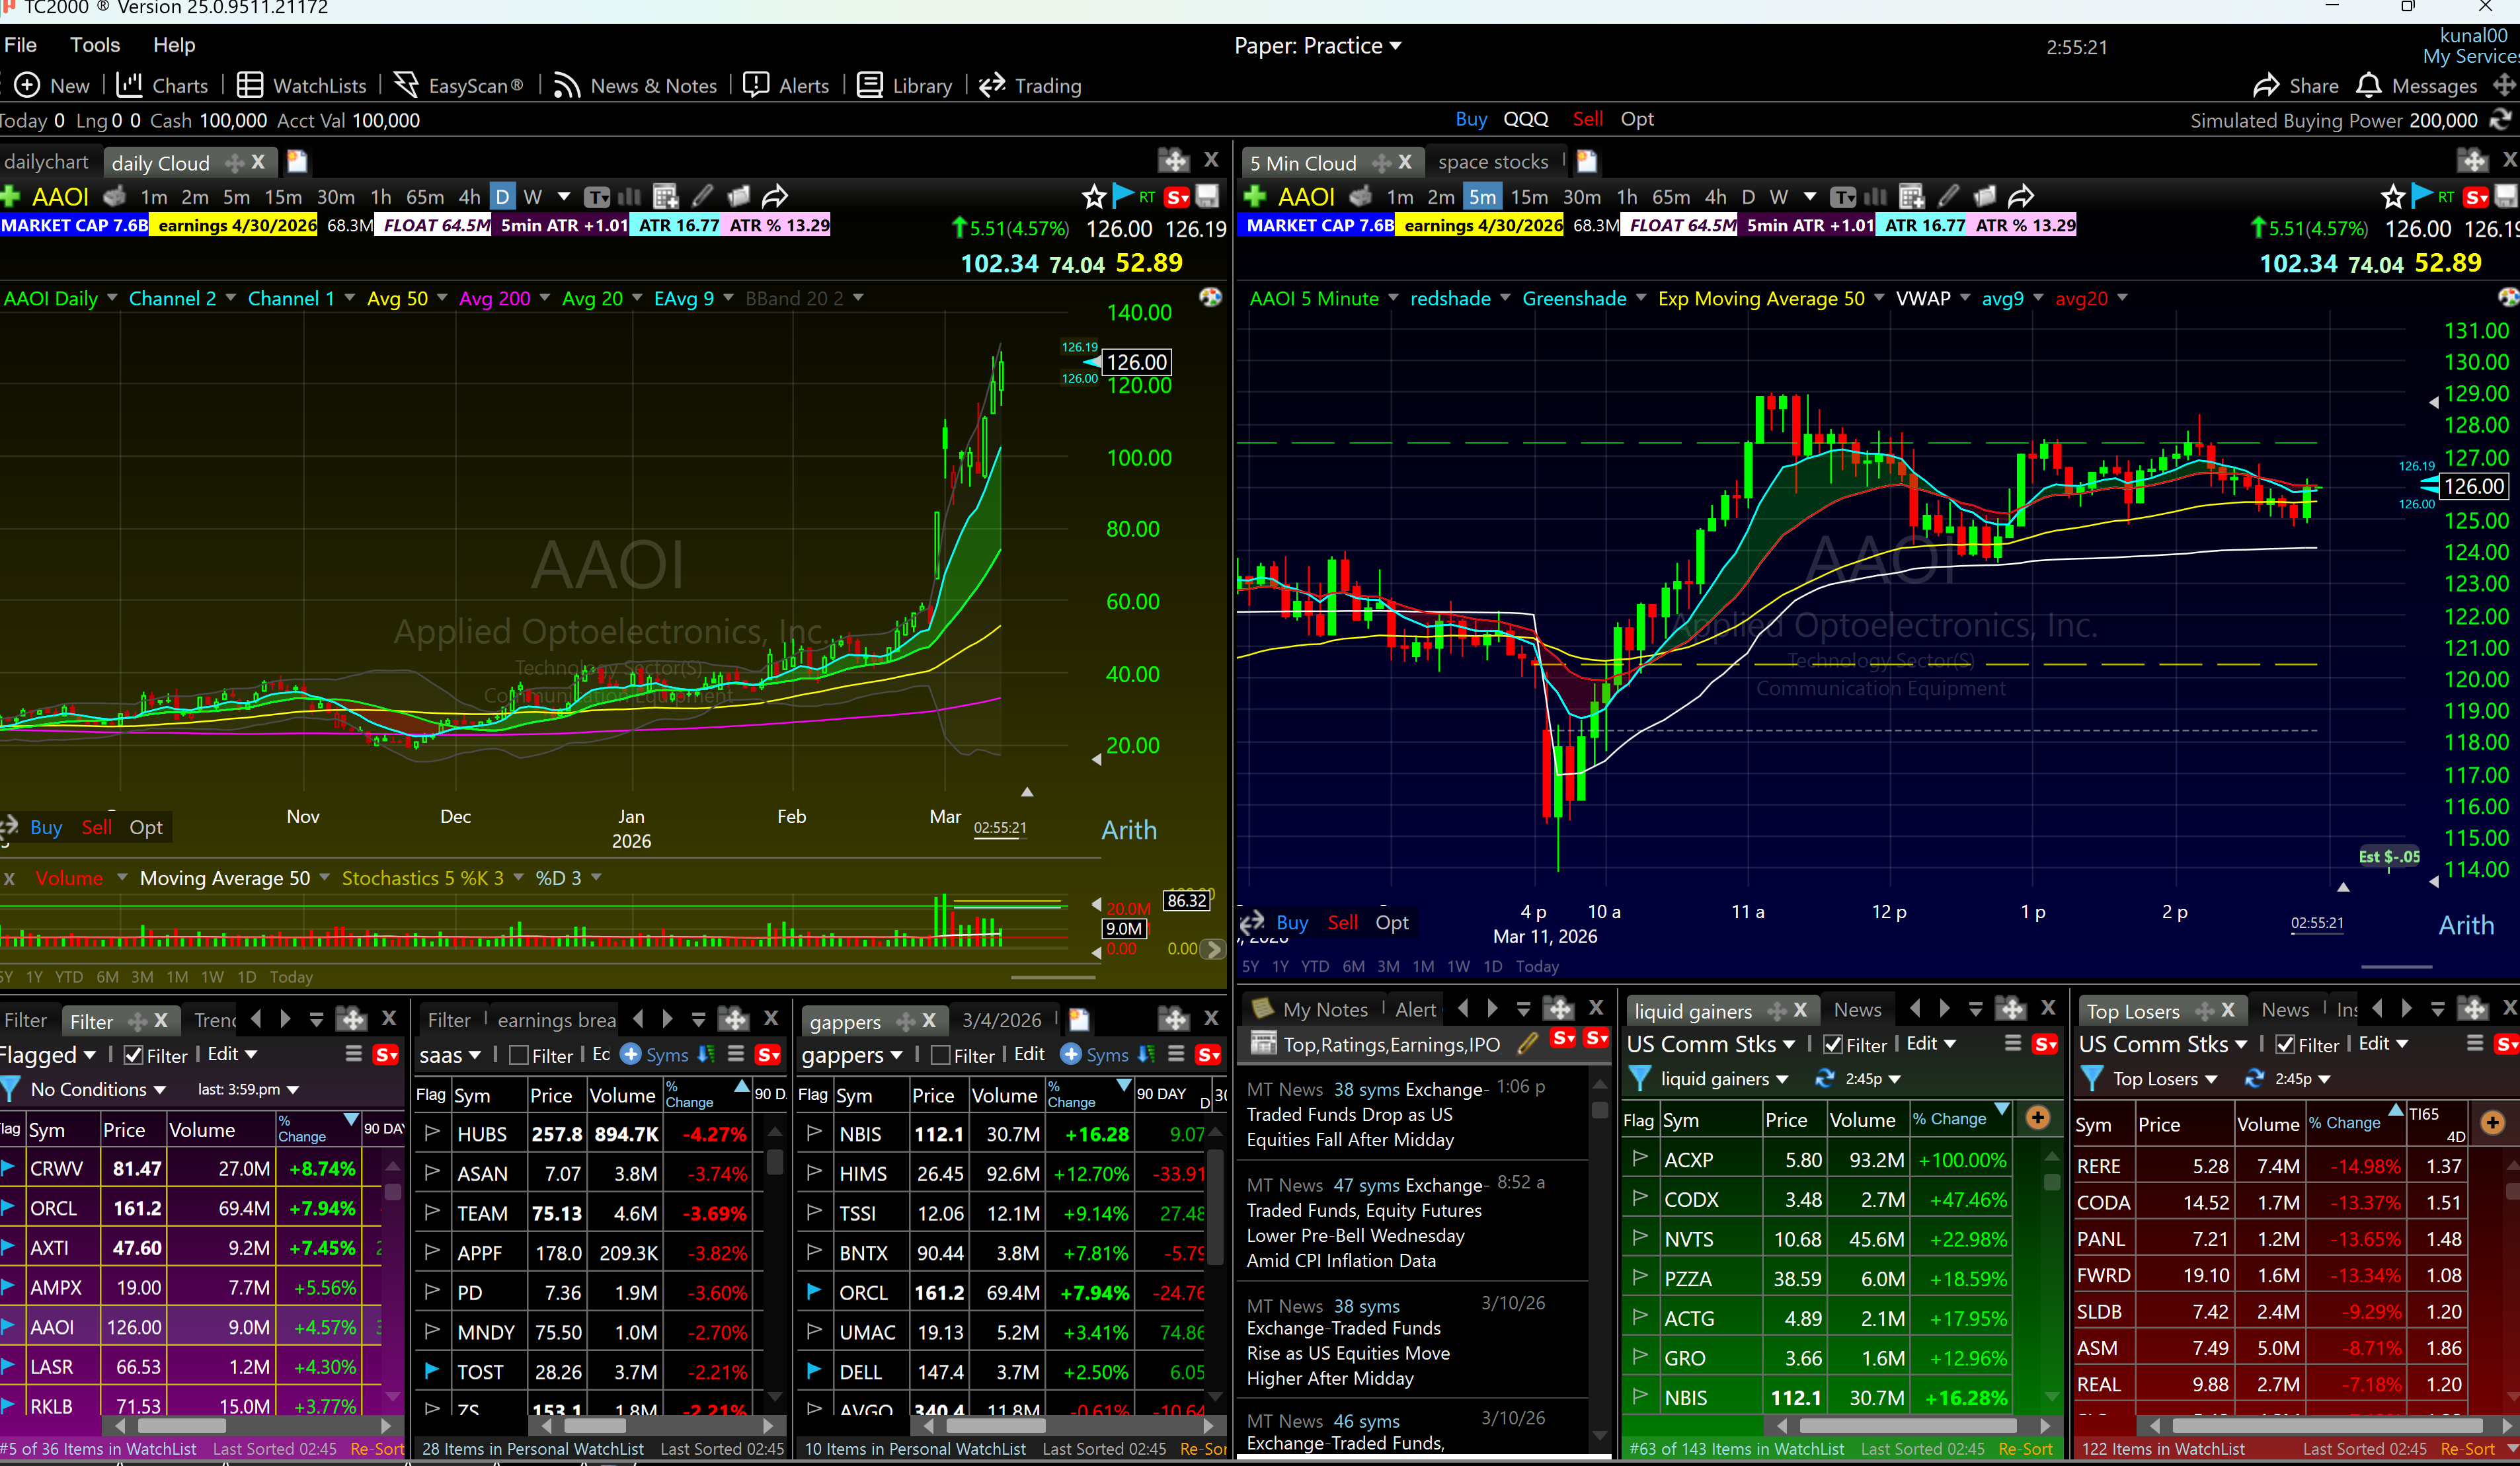
On June 9 I lost $5,000 on AAOI breaking my own 3-Candle Rule, and I am putting the chart here because it is the most expensive ORB tutorial I can offer you.
I loved the daily chart on AAOI at the time. The stock pushed up off the open and I bought the third candle. Here was the problem: the range had never actually formed. There was no tight lid near the top for candle 3 to break. Three candles had printed, but they were not a completed consolidation, which means there was no completed ORB pattern at all. I was not trading the setup. I was counting candles and calling it the setup.
Five minutes after I added, the stock got rugged. I was stopped out, and with the spread I lost another point and a half to slippage on the way out. The SEC warns in its bulletin on stop orders that your stop price is not a guaranteed execution price, and fast gappy stocks like AAOI are exactly where that warning bites. Wide spreads turn a planned loss into a bigger one.
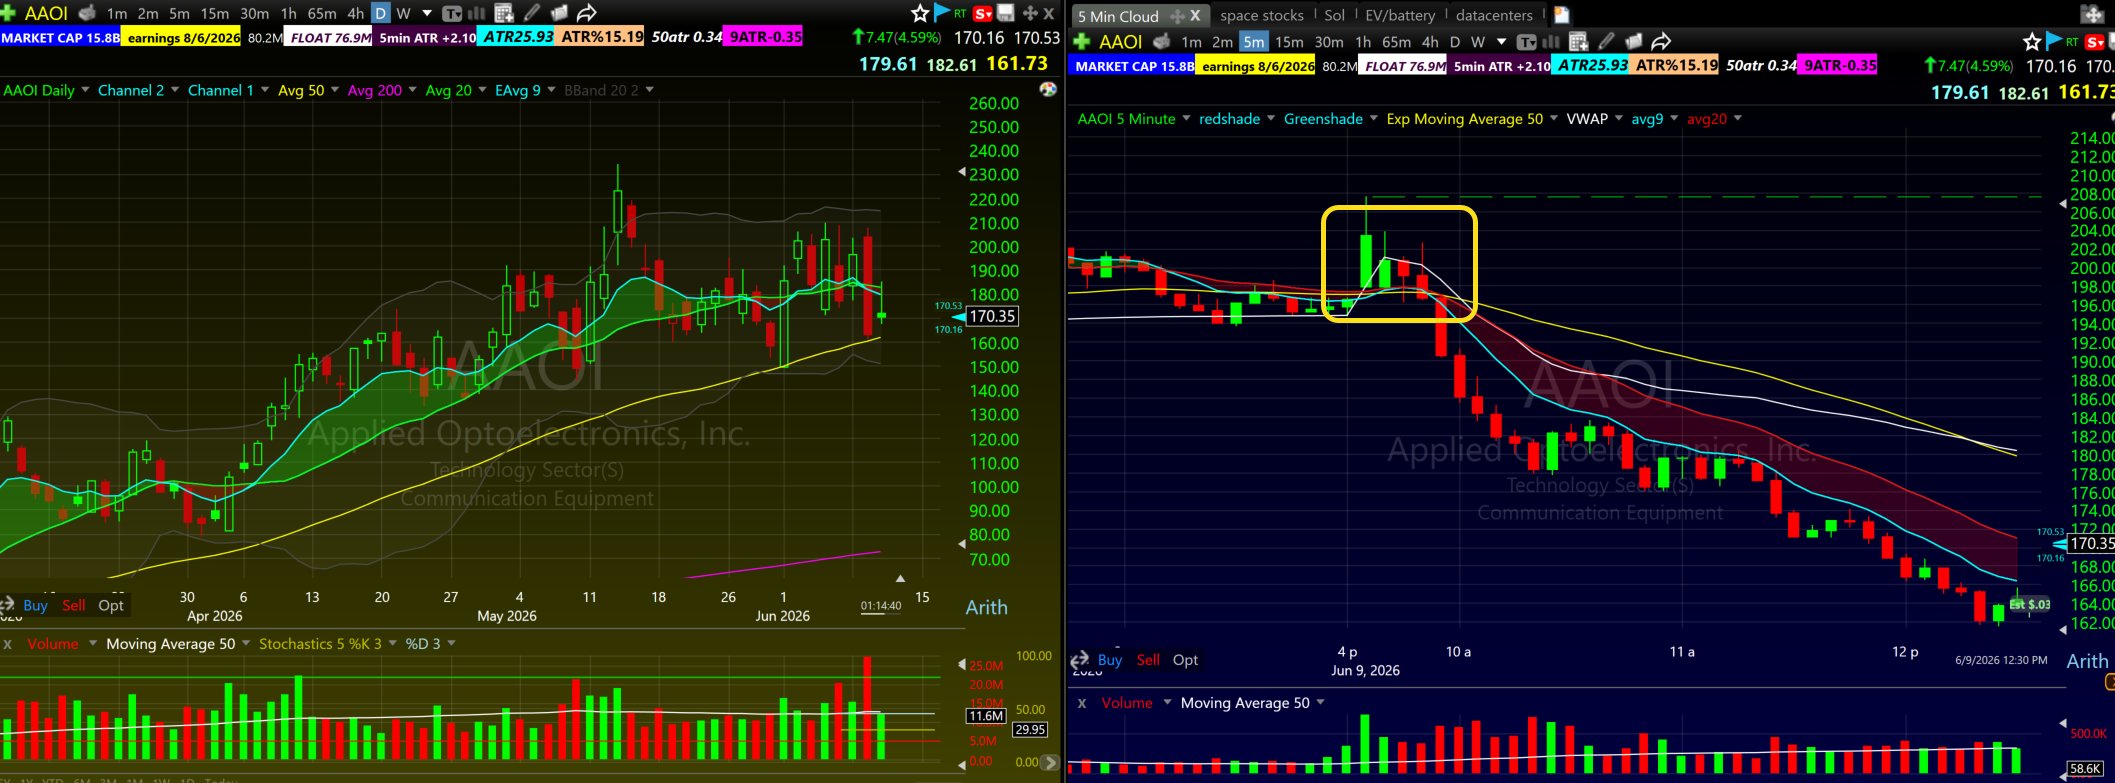
Read the rule again with fresh eyes. The 3-Candle Rule is not wait three candles then buy. It is wait for a tight, completed range, which takes a minimum of three candles, and then buy the break of that range. The lid is the pattern. The candle count just tells you the earliest moment a real lid can exist. Three candles with no lid is nothing, and I paid $5,000 this week to remind you of that.
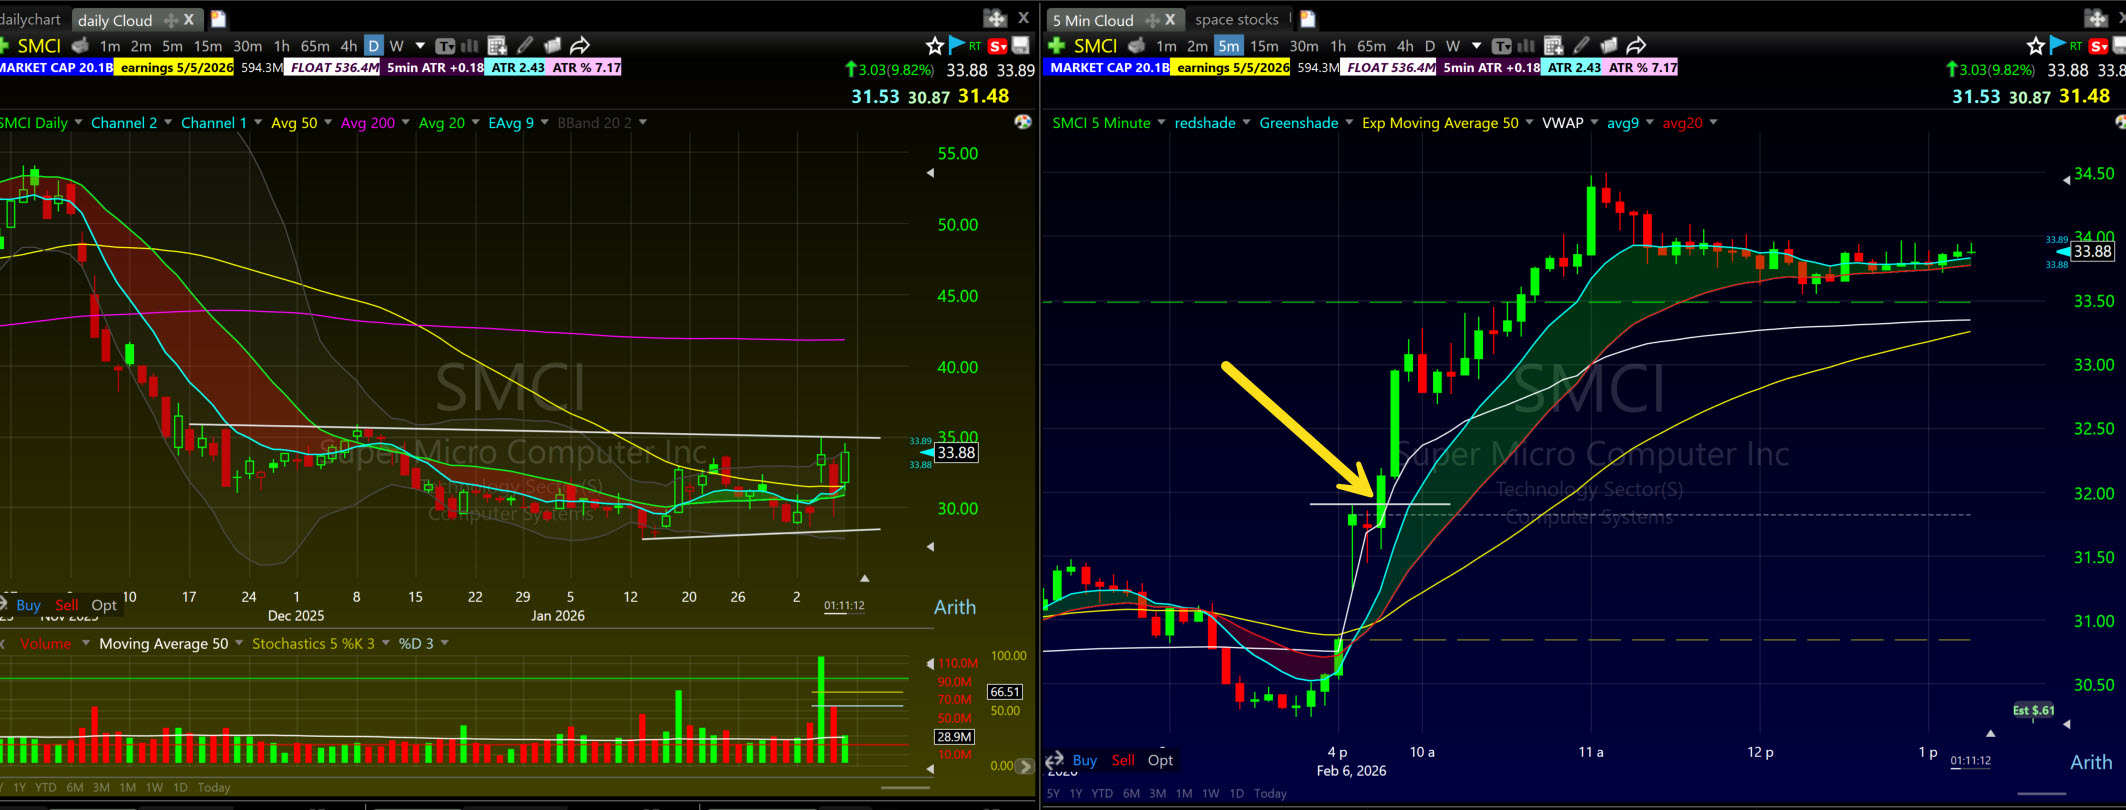
The SMCI Trade: What a Real ORB Looks Like
SMCI gapped up to $32 on news. On the 5-minute chart it formed a tight 3-candle consolidation. Textbook lid. The Bone Zone curled up underneath. Candle 3 broke $32 on volume. Stop at VWAP. SMCI ran to $34+ with the Bone Zone holding the entire move.
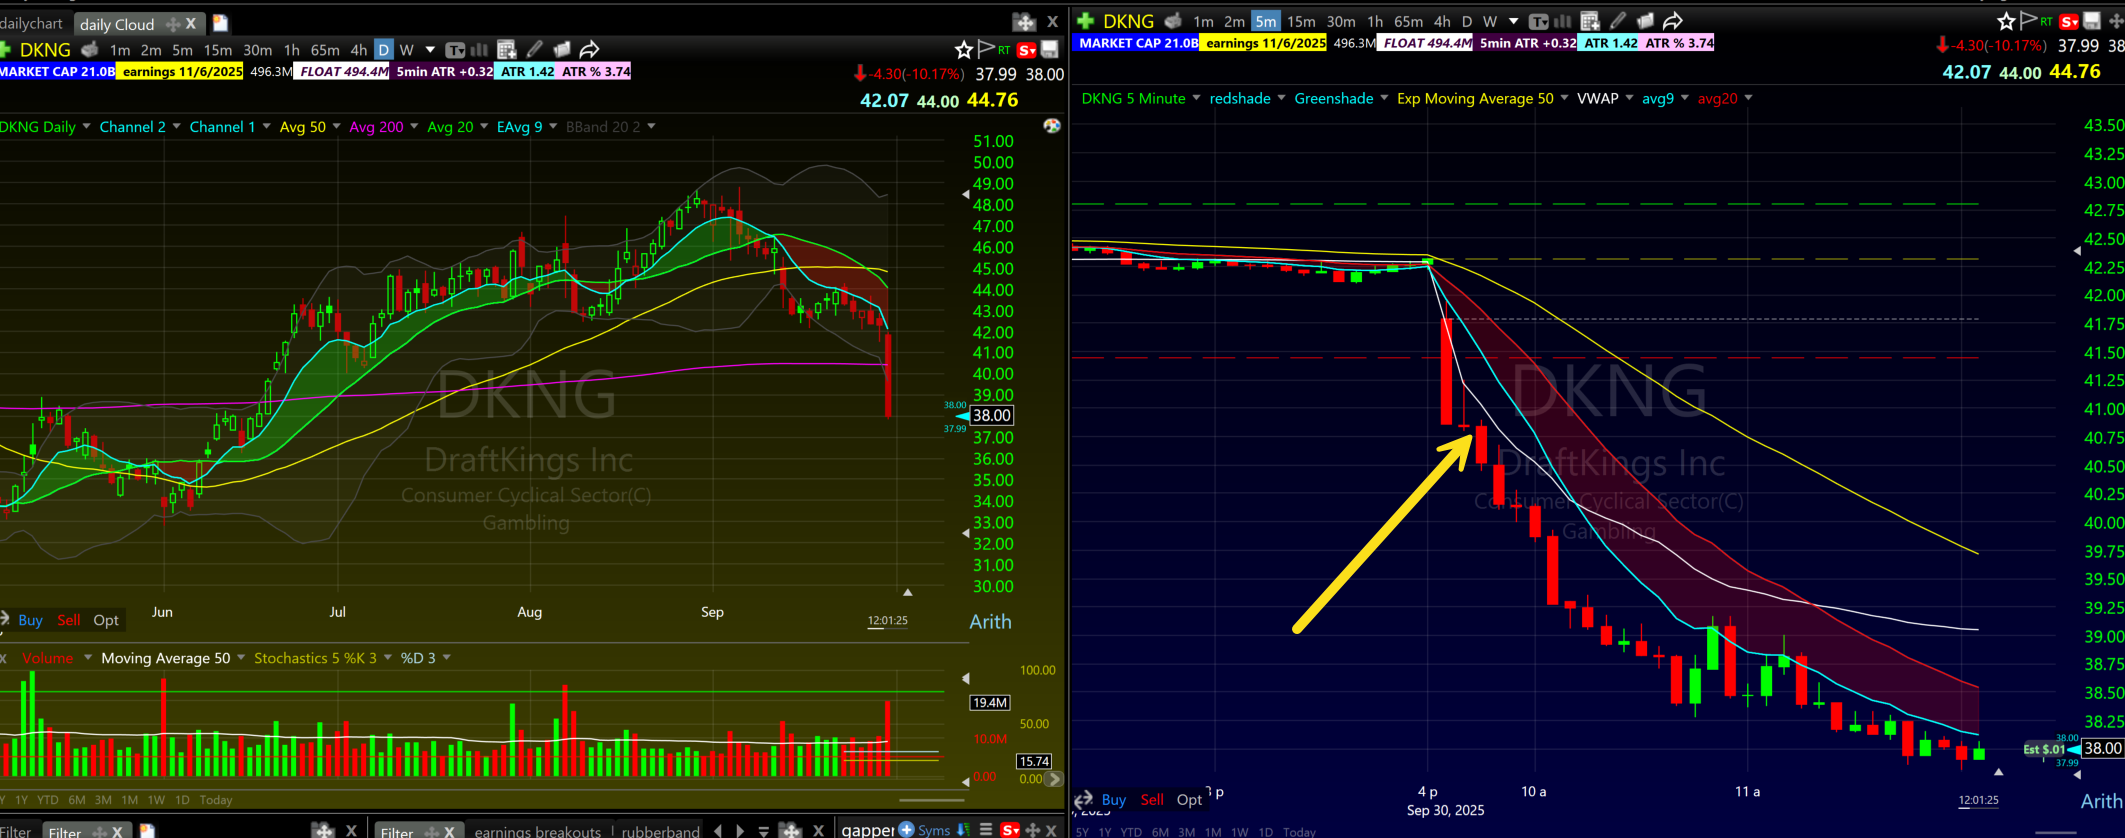
How to Trade the Downside ORB: DKNG
DKNG reported earnings and missed. Gapped from $44 to $42. Daily chart already rolling over, red Bone Zone, distribution. On the 5-minute, a tight 3-candle lid formed. VWAP sat above as the ceiling. Candle 3 broke below the consolidation low. Short entry. Stop above VWAP. DKNG bled to $38 with the red Bone Zone holding as resistance the entire way down.
Match the ORB to the Market Cycle
Here is what none of the generic ORB guides will tell you: the same setup, traded the same way, produces different results depending on where the market is in its cycle. ORB hit rates are not a property of the pattern. They are a property of the tape.
In a fresh stage one bull market, opening range breakouts fire clean and run. Buyers are aggressive, breakouts get follow-through, and the lid breaks hold. In a tired, extended market, you will see far more ORBs fail. The market is stretched, early buyers are selling into strength, and breakouts get faded.
And when the indexes start breaking under their moving averages, you flip the whole playbook. You do more ORB shorts, which is just the opening range breakdown: gap down, tight lid forms under VWAP, candle 3 breaks the low of the range, stop above VWAP. Same anatomy, mirrored.
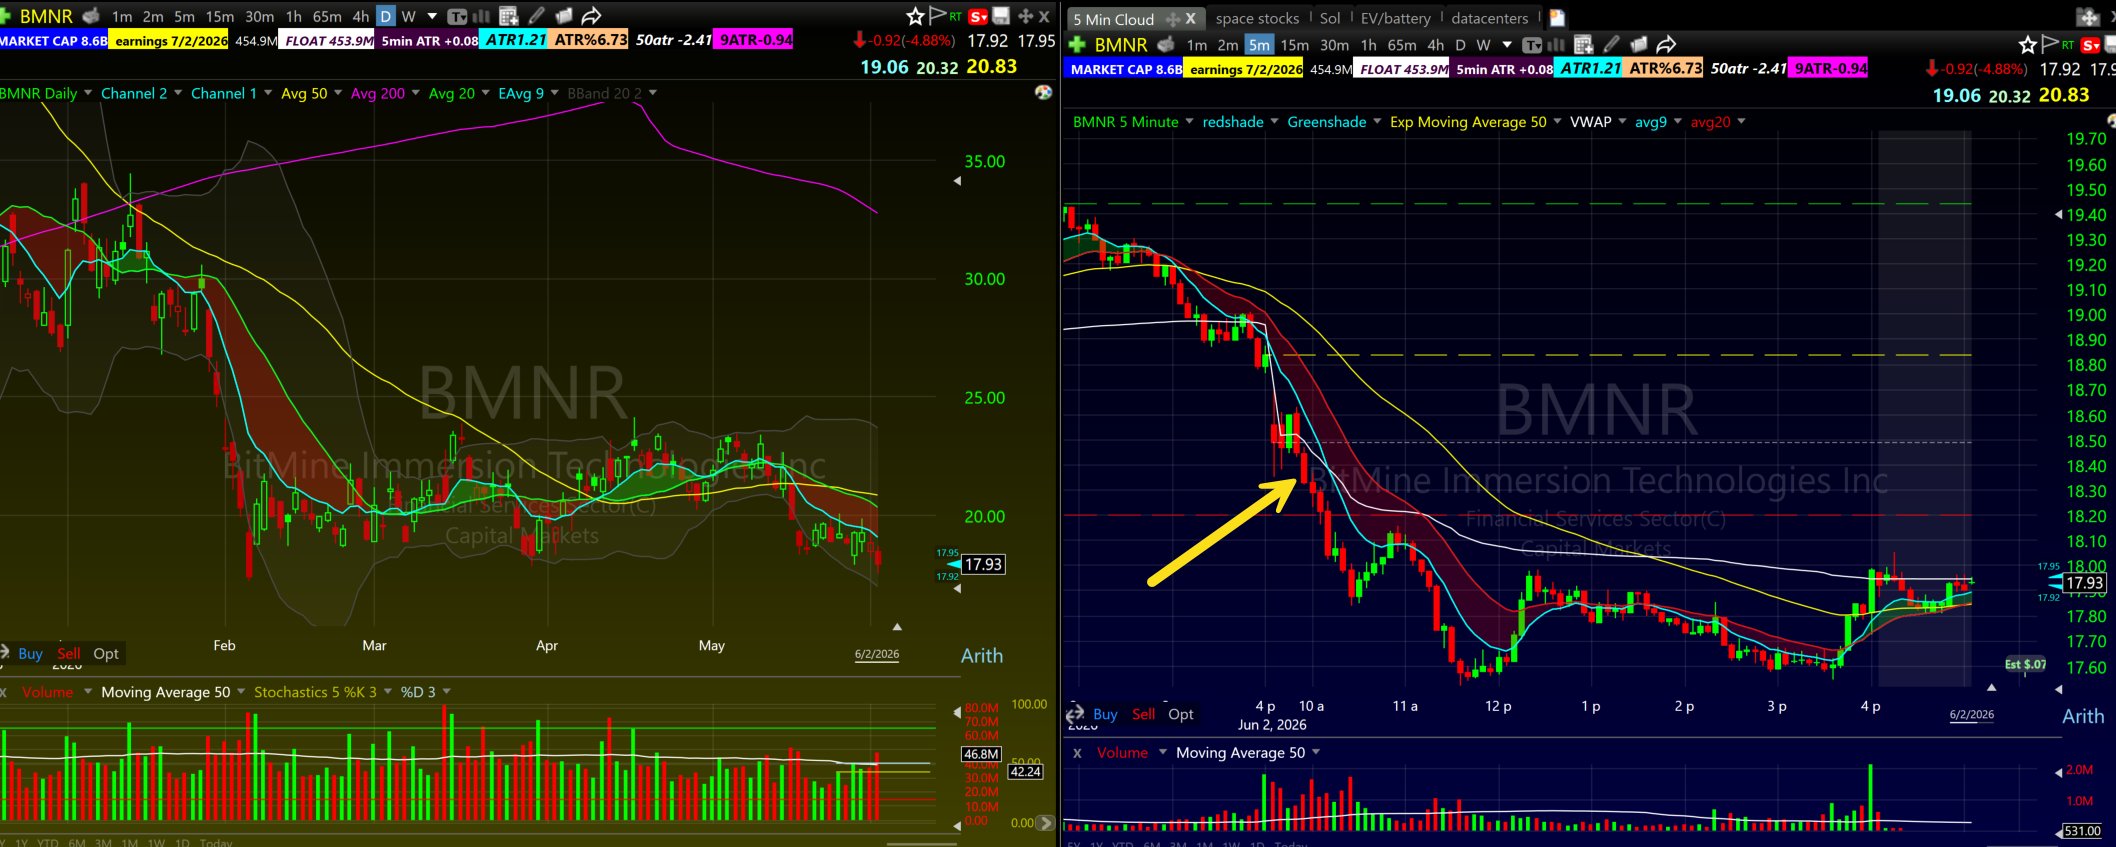
That is exactly what I am doing right now. We are still in an overall bull market, but the tape is starting to grind down and we are seeing distribution, so my basket has shifted toward more shorts. Here is BMNR from June 2, a clean opening range breakdown that bled all morning under a red Bone Zone.
Matching your basket of longs and shorts to the cycle is how you keep your hit ratio up when the market gets heavy. Forcing long ORBs into a distribution tape is how you give back a month of gains in a week.
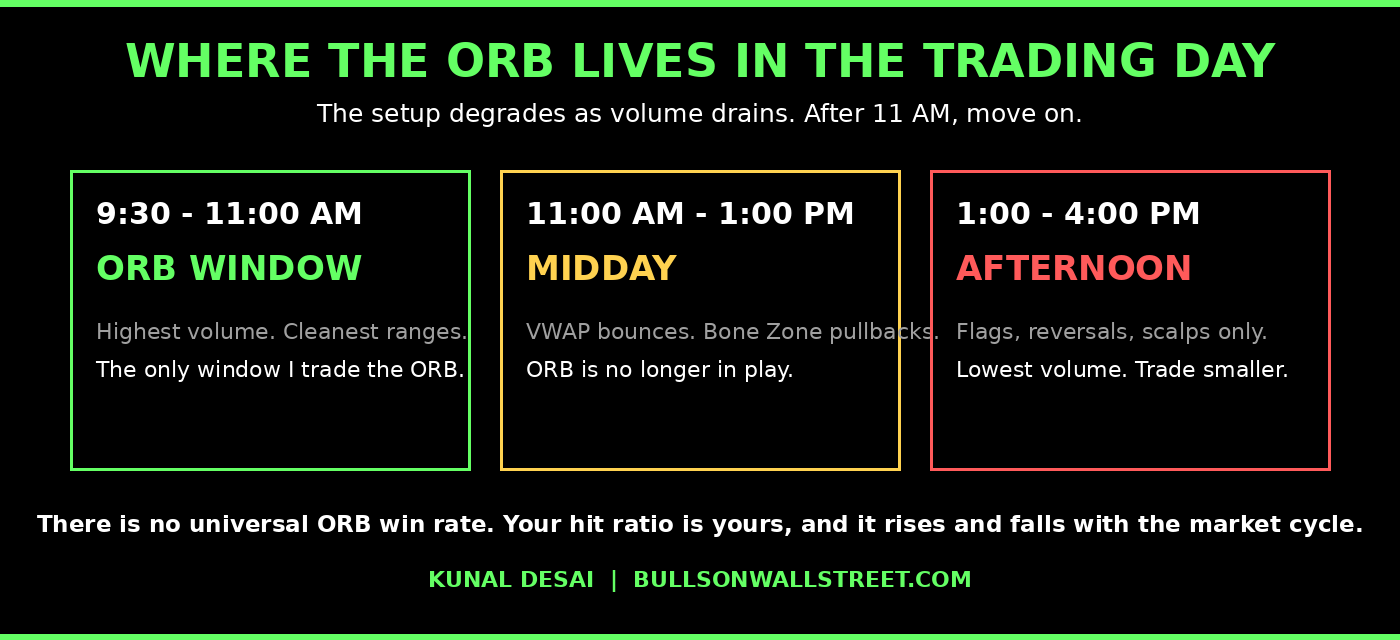
Where the ORB Fits in the Full Trading Day
9:30 AM to 11:00 AM: The ORB lives here. High volume, high volatility, cleanest setups. If it has not triggered by 11:00 AM, move on.
11:00 AM to 1:00 PM: VWAP bounces and fades. Bone Zone pullbacks. The ORB is not in play. The later you are in the day, the deeper the pullbacks need to be and the longer the patterns need to take to form.
1:00 PM to 4:00 PM: Flags, reversals, scalps only. Lowest volume. Trade smaller.
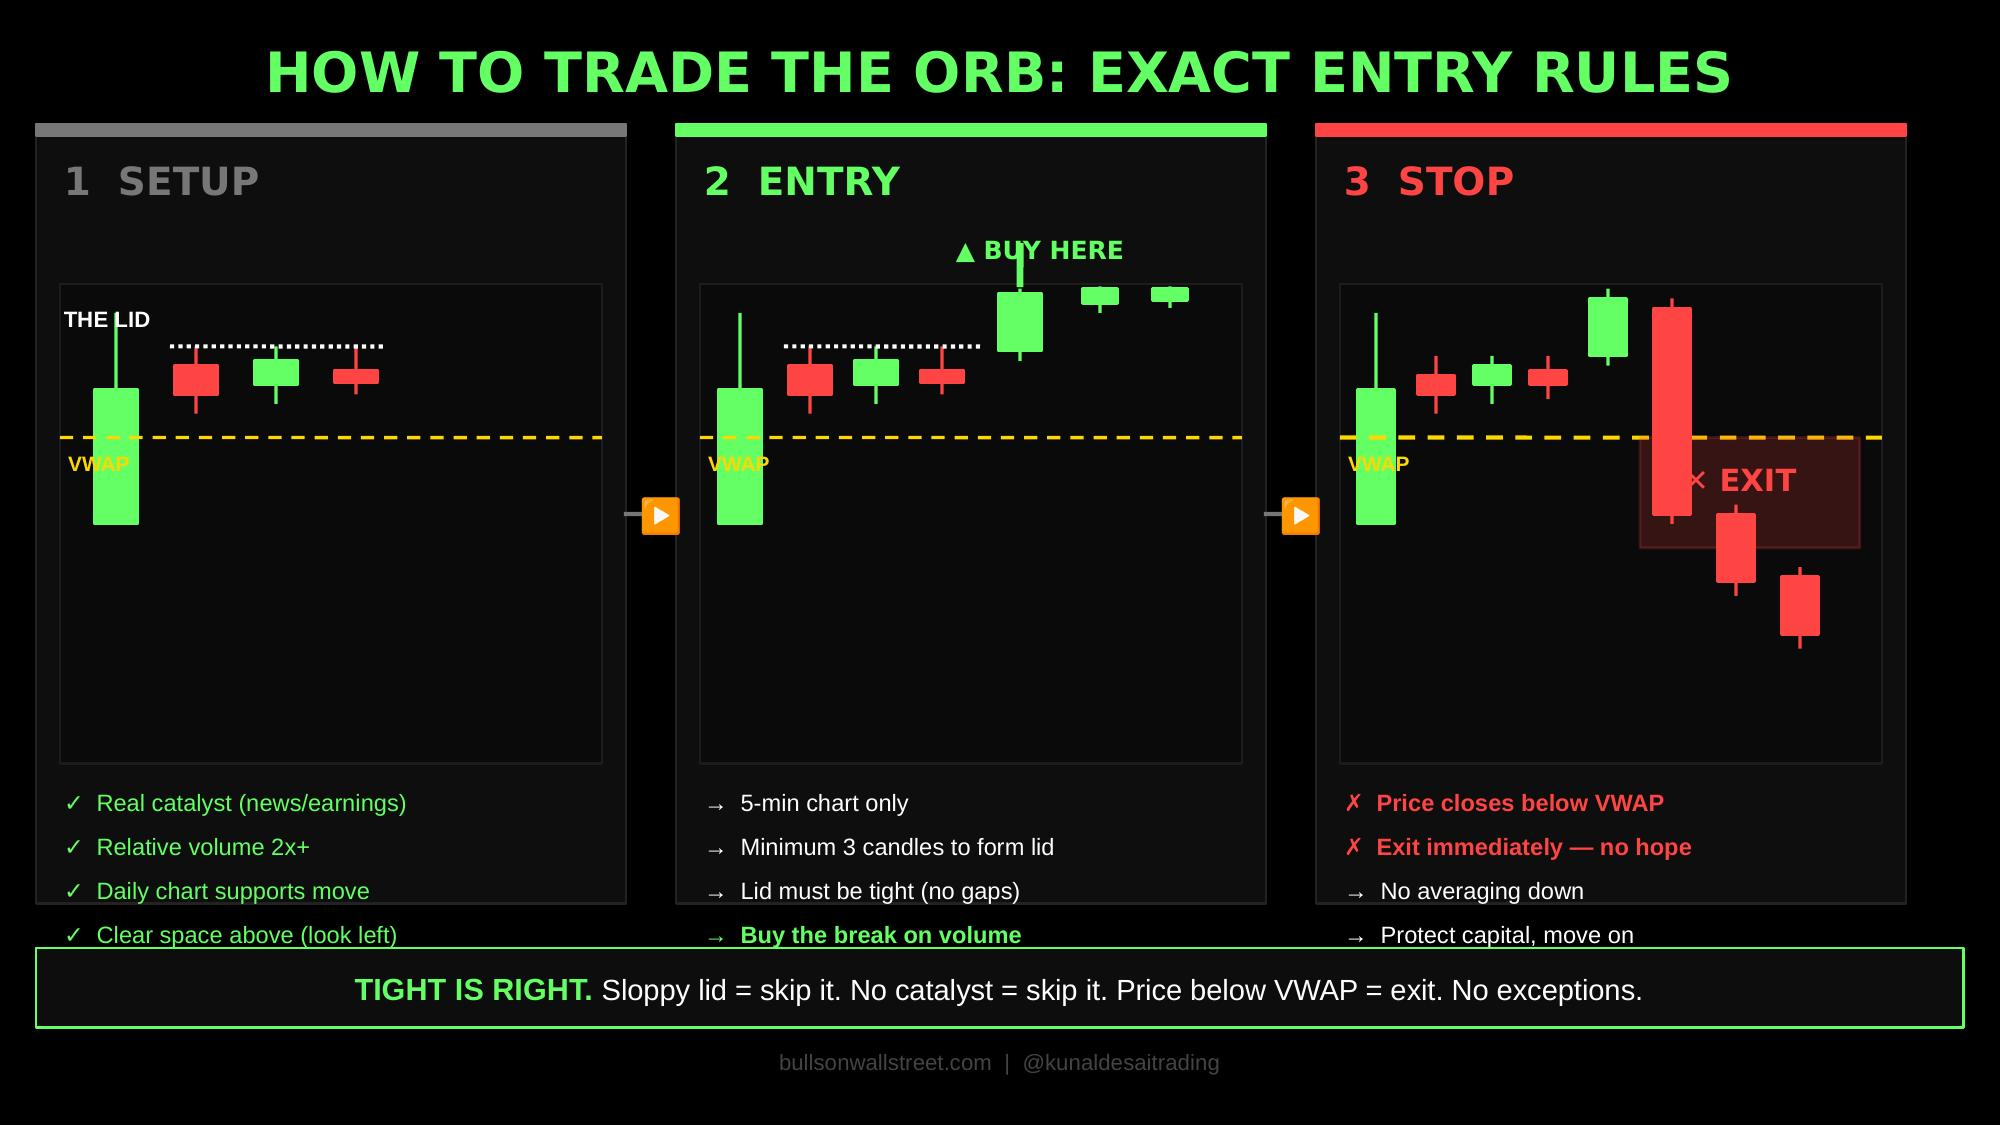
How to Trade the ORB: Exact Entry Rules
Setup requirements: Real catalyst. Relative volume 2x+. Daily chart supports the move. Look left for clear space above, not gapping into resistance.
Entry: 5-min chart. Minimum 3 candles forming a tight, completed lid. Candle 3 or later breaks the consolidation high on volume. Buy the break.
Stop: VWAP. Price falls below VWAP, exit immediately.
Target: No hard target. Use ATR. This is where I run the Free Trade, the exit system from my risk management system: sell half around 1x ATR when the trade has paid my risk, then trail the rest with the 9 EMA. Once that first half is off, the trade is free. The Bone Zone holds, I let it run. The 9 EMA breaks, I exit.
Size: 1% account risk max, the same 1% Rule that anchors my entire risk system. Stop distance to VWAP determines shares.


A Real ORB Never Comes Back
Every generic ORB guide on the internet teaches the retest entry: wait for the stock to break the range, come back down, retest the broken lid, and buy there. I do not trade the retest, and here is the reason.
A great opening range breakout does not come back to retest the range. When I say never I do not mean literally never, but it is very rare. A real ORB breaks out and does not look back for 30 or 40 minutes. The strength of the move away from the lid is the confirmation that the breakout was real.
So flip the logic. If a stock breaks the lid and then quickly comes back to retest it, that is not a gift entry. That is the market telling you this was never a great ORB in the first place. The retest IS the failure signal, and the guides teaching you to buy it are teaching you to buy the weakest version of the pattern.
If I miss the break, I do not chase and I do not stalk a retest. I wait for the first pullback into the Bone Zone instead. Tighter stop, better structure, and it only appears on stocks strong enough to have run first.
Your Win Rate Is Not a Statistic
The generic sites will quote you an ORB win rate of 40 to 60 percent. I am going to tell you something more honest, from nearly 20 years of running a live trading chatroom.
If I give 1,000 people the exact entry and the exact exit they need to make money on a stock, almost none of them will duplicate it. People find ways to add their own fear, their own greed, and their own bias to every trade. The same setup, the same alert, the same levels, and a thousand different outcomes. So there is no generic win percentage for the ORB. There is only your win percentage, and it is built from your execution, your discipline, and your screen time on the pattern.
The second honest thing: whatever your personal hit ratio is, it will rise and fall with the market cycle. Clean filtered ORBs in a fresh bull tape are a completely different bet than forced ORBs in an extended, tired market. Track your own numbers in a journal, on your setups, in this market. That number is the only one that matters.
Common ORB Mistakes
Buying candle 1 or 2. The range is not formed. You are guessing. Wait for the lid.
Counting three candles without a completed lid. That was my $5,000 AAOI mistake above. The lid is the pattern, not the candle count.
Trading sloppy ORBs. Messy consolidation with no defined range. Skip it.
Ignoring the daily chart. Gapping into resistance on the daily drops probability hard. Always look left.
Using the 1-minute chart. Too noisy. Too many false signals. 5-minute only.
Putting the stop under the consolidation low instead of VWAP. It gets taken out on normal wicks. VWAP is the real anchor. See my VWAP guide.
Trading after 11:00 AM. Volume and volatility both drop and the setup degrades. After 11 AM, switch to patterns suited for midday, like VWAP bounces and deeper pullbacks.
Buying the retest. Covered above. A real ORB does not come back. The retest is the failure tell, not the entry.
Chasing a missed entry. Stock already ran $1 past the break? Wait for the first pullback instead.
Setting Up the ORB in TC2000
Start with your main layout in TC2000 and run your scans. Then I transfer the names to the 6-window layout so I can monitor 6 charts at once. No more than 6 names in the 9:30 to 11:00 AM window. If it is not on my pre-market watchlist, I am not trading it at the open. Build your pre-market scanning system with my day trading scanning guide.
According to FINRA guidance on day trading, having a defined system with pre-set entry and exit criteria is one of the primary differentiators between traders who survive and those who do not.
ORB vs. First Pullback: How They Work Together
The ORB is the primary entry. Catch the breakout on candle 3. If you miss it or the entry is sloppy, the first pullback is the secondary. After the ORB runs, the stock pulls back to the 9 EMA or into the Bone Zone. Declining volume, green candle holds the EMA, that is the entry. Both setups come off the same stock, in the same 9:30 to 11:00 AM window. Master both and you have a complete morning system.
FAQ: How to Trade the Opening Range Breakout
What is an opening range breakout?
A day trading strategy where a stock gaps up on a catalyst, consolidates in a tight range, then breaks through the top of that range with volume.
How many candles before entering?
A minimum of 3 on the 5-minute chart, but the candles must form a tight, completed lid. Three candles without a defined range is not an ORB. Over half the time a real ORB triggers on candle 3 exactly.
Why the 5-minute and not the 1-minute?
The 1-minute has too much noise, false breakouts and micro-scalp traps. The 5-minute gives cleaner candles, cleaner ranges, cleaner breaks.
Where does the stop go?
At VWAP. Not the consolidation low, which gets stopped out on normal wicks. When price falls below VWAP, buyers have lost control. See my VWAP guide.
What happens when an ORB fails?
You exit at VWAP immediately and expect slippage on fast stocks with wide spreads. A failed breakout that falls back into the range is dead. Do not average down and do not wait for it to re-break. My AAOI loss above is exactly what this looks like.
Should I buy the retest of the opening range?
No. A great ORB rarely comes back to retest the range. It breaks out and does not look back for 30 or 40 minutes. A quick retest means the breakout was weak. If you miss the entry, wait for the first pullback instead.
Clean ORB vs sloppy?
Clean has a tight contained lid: small candles, similar highs, similar lows. Sloppy has wide overlapping candles and no defined range. Trade the lid. Skip the sloppy ones.
Best time of day?
9:30 to 11:00 AM only. After 11 the setup degrades.
What is the ORB win rate?
There is no generic ORB win rate. After nearly 20 years running a live chatroom, I can tell you that 1,000 traders given the same exact entry and exit will produce 1,000 different results, because everyone adds their own fear, greed, and bias. Your win rate is personal, and it rises in fresh bull markets and falls in tired extended ones. Track your own numbers.
Does the ORB work in all markets?
It works best in fresh bull conditions with stocks above the 50 SMA on the QQQ. In an extended, tired market more ORBs fail, and when the indexes break under their moving averages, flip to opening range breakdowns on the short side and match your basket of longs and shorts to the cycle.
How do I find ORB candidates?
Pre-market scan: real catalyst, relative volume 2x+. See my scanning guide.
What is the Bone Zone?
The shaded area between the 9 EMA and 20 EMA. After an ORB breaks out, the Bone Zone catches the first pullback and acts as support for continuation. Visible on every 5-minute chart in TC2000.
Can you trade the ORB short?
Yes, the same rules mirrored. Gap down, tight lid under VWAP, break below the range on candle 3, stop above VWAP. That is exactly how I traded ORBs in 2008, mostly to the downside, and it is what I am leaning on in the current tape. See the BMNR breakdown above and my day trading strategies guide.
What makes the ORB different from a regular breakout?
Timing and context. The ORB is specifically the first consolidation of the day, right after a morning push, during the highest volume window. That makes it a distinct, higher-probability version.
How to Trade the ORB the Right Way
Three candles minimum forming a tight, completed lid. Entry on the break. Stop at VWAP. Sell half at 1x ATR and trail the rest, the Free Trade way. 5-minute chart only. 9:30 to 11:00 AM only. Match your longs and shorts to the market cycle. That is the system. Follow it or do not trade it at all.
If you want to learn how I trade the ORB in real time, calling out the setup live, showing the entry, managing the trade as it develops, this is exactly what we do every day in the 60-Day Trading Bootcamp. Over 7,000 students. The ORB is one of the first setups we cover because it pairs with the first pullback to give you a complete morning system.
Watch live trade breakdowns on the Bulls on Wall Street YouTube channel. The pre-trade checklist covers every entry. The risk management guide covers sizing and the Free Trade exit. And if you are still learning to read the candles themselves, grab my candlestick patterns PDF. Research in the Journal of Financial Markets confirms intraday momentum strategies in the first 30 minutes consistently show the highest risk-adjusted returns. The edge is real. You just have to be disciplined enough to execute it.
Written by Kunal Desai, founder and CEO of Bulls on Wall Street. Trading professionally since 1999, full-time since 2007. Founder of BOWS in 2008, 7,000+ students trained through the 60-Day Trading Bootcamp. Featured in Forbes, Fortune, and Inc. Trades momentum stocks daily using TC2000. Live analysis on the Bulls on Wall Street YouTube channel.