

Updated June 2026. Here is how to use VWAP for day trading the way a professional actually does it: VWAP is not a buy or sell button. It is one piece of evidence in a case you build before risking a dime. Use it to confirm a setup that already has a price pattern, real volume, and trend behind it, and your odds jump. Use it blindly and you are flipping a coin. This guide breaks down the four VWAP setups I trade every day, with real trades I took on June 5, 2026, and the win-rate data behind them.
If you do not yet know what VWAP is or how it is calculated, start with the companion guide on what VWAP is and why it matters. That post covers the definition, the formula, and the daily reset. This one is about execution: how to actually trade the line.
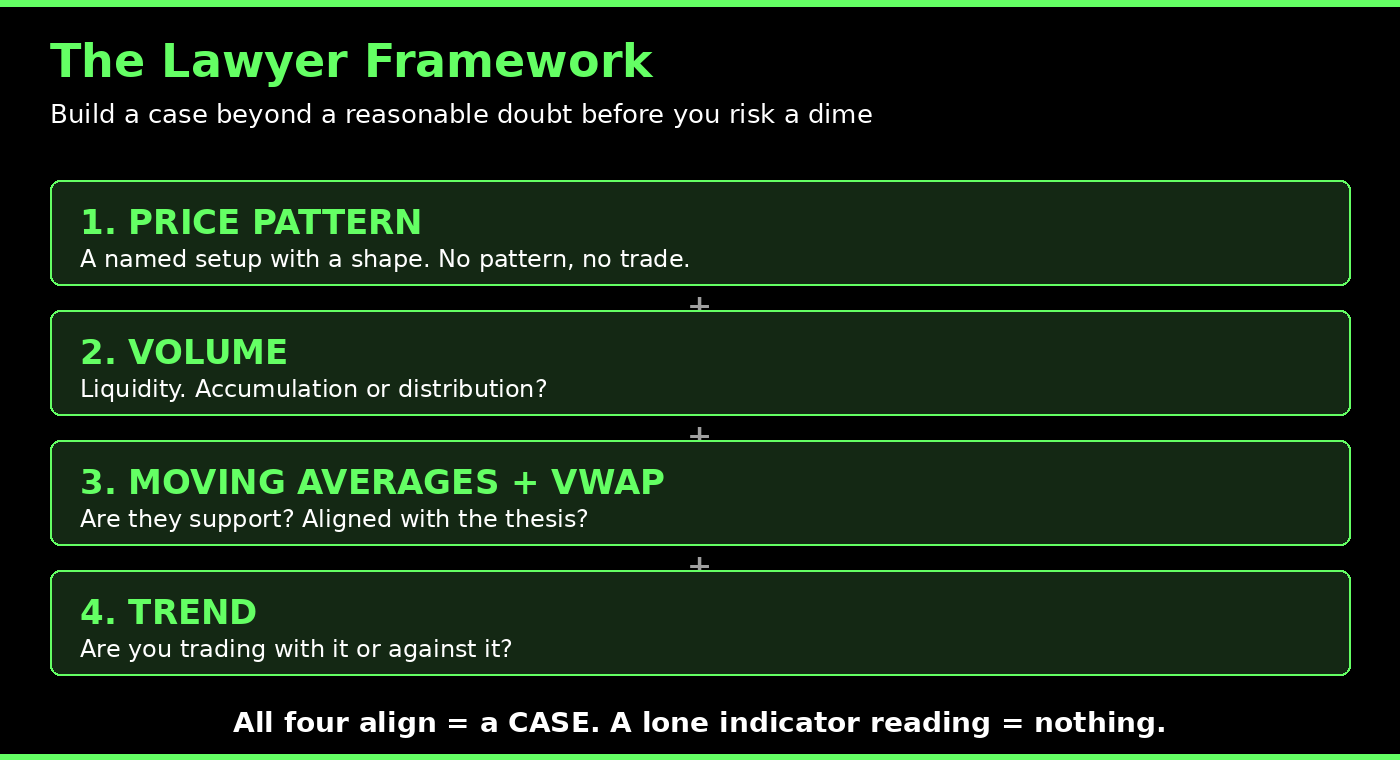
The Lawyer Framework: VWAP Is Evidence, Not a Verdict
The number one mistake new traders make with any indicator, VWAP included, is using the indicator to make the buy and sell decision. That is not how trading works. That is not how I have traded through every market cycle since I went full time at the end of 2007, and it is not what I teach the 7,000-plus students who have come through our bootcamp.
Think like a lawyer. You are building a case on a stock, assembling evidence on why it is worth your time and your money. Every trade starts as a coin flip, a 50/50 shot. Your entire job is to move the needle toward something much higher probability before you commit capital. You do that by stacking evidence in order:
First, the price pattern. The setup has to have a name and a shape. No pattern, no trade. Second, volume. Does the stock have liquidity? Is it under accumulation or distribution? Third, the moving averages and VWAP. Are they providing support? Are they aligned with your thesis? Fourth, the trend. Are you trading with it or against it?
When all of those factors line up, you have a case. A lone reading of hey there is VWAP, or hey there is the 9 EMA, means nothing on its own. You must build a case. You are looking for proof beyond a reasonable doubt that a trade is worth taking. VWAP is a witness in that case. Sometimes it corroborates your thesis. Sometimes it is the witness that breaks it. Either way, it does not get to be the judge.
Why Institutions Care About VWAP (And Why That Gives You an Edge)
VWAP matters because the biggest players in the market are graded against it. When a fund manager has to move hundreds of thousands of shares across a trading day, their execution desk gets measured on whether the average fill came in better than VWAP. This is tied directly to the regulatory duty of best execution, which requires firms to seek the most favorable terms reasonably available for customer orders, a standard spelled out in FINRA Rule 5310.
That single fact drives real behavior, and it ties back to the basic mechanics of how stock markets work. Algorithms buy dips toward VWAP when they are accumulating and sell rallies above it when they are distributing, not because the line is magic, but because their performance is judged against it. When every serious desk is watching the same line and trading around it the same way, it becomes real support and resistance. Understanding how orders actually get filled, which the SEC explains in its primer on executing an order, is what separates traders who use VWAP with intent from those who just slap it on a chart.
The Slope Filter: The First Thing I Check
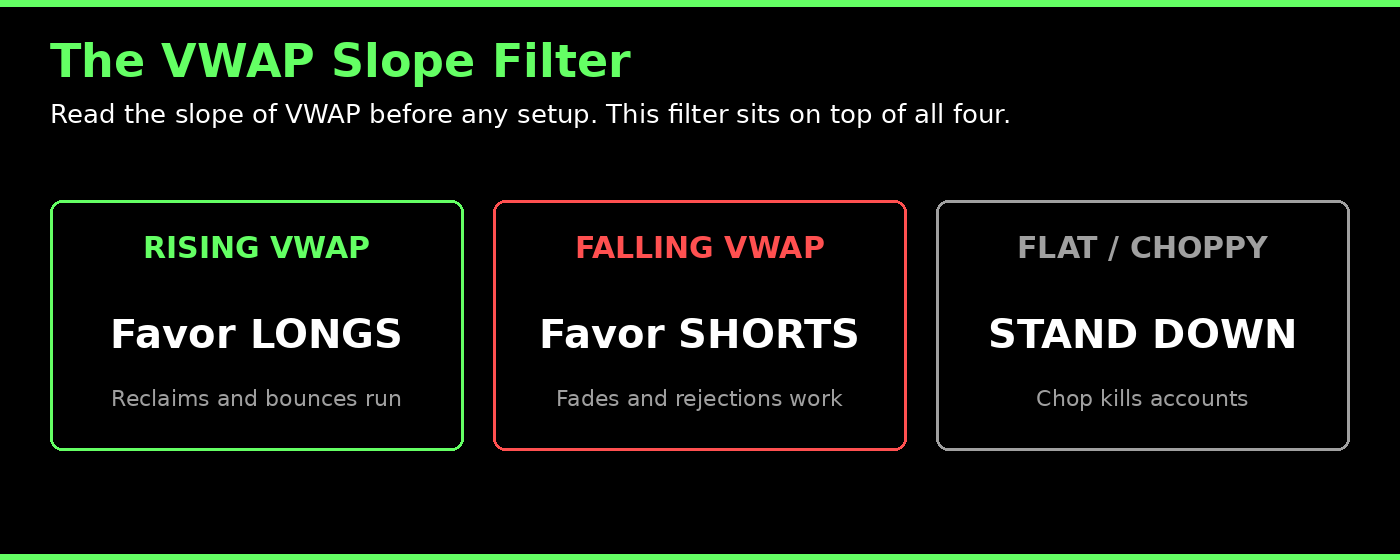
Before I take any VWAP setup, I read the slope of the line. This is the master filter that sits on top of all four setups.
Rising VWAP favors long setups. Falling VWAP favors short setups. Flat, choppy VWAP usually means chop, and chop is where accounts go to die. When VWAP is flat and price is knifing back and forth through it, that is not a battlefield you want to fight on. You stand down. Reading slope first is the difference between trading the line and getting chopped up by it.
The 4 VWAP Setups I Trade Every Day
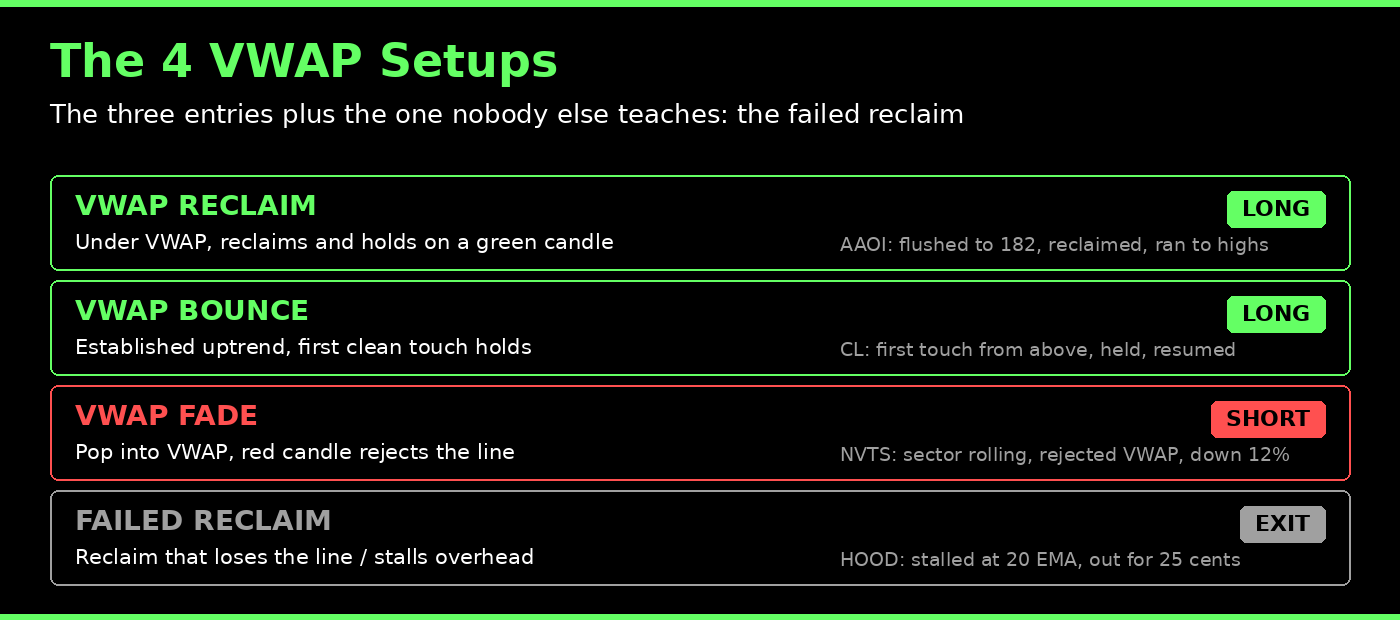
There are four ways I trade VWAP. Three of them are entries. The fourth is the one nobody else teaches: the failure. Naming the failure is what keeps you honest and keeps your account alive.
1. The VWAP Reclaim (Long)
The reclaim is a long setup. The stock is trading below VWAP, then reclaims it and holds on a green candle. That reclaim is a shift in sentiment: the collective that was underwater is now back above water, and that flips behavior from selling rallies to buying dips.
Real trade, June 5, 2026: AAOI. Applied Optoelectronics was hot the previous day with a big breakout on the daily chart. That is the price pattern and the trend, evidence one and four already in the file. At the open it flushed down to 182. Most traders panicked. I was watching for the reclaim. When it ripped back over VWAP and held, the case was complete: daily breakout, rising structure, reclaim confirmation. We added long in the Bulls on Wall Street chatroom, and it ran back to the high of day and beyond. The reclaim was not the reason I took it. It was the trigger that fired a case I had already built.
The mechanics of waiting for confirmation rather than guessing a bottom are the same ones I cover in the first pullback trading strategy guide, and the full setup playbook lives on my day trading strategies page. Patience for the green candle is the whole edge. If you need a refresher on reading candles, my candlestick chart patterns PDF covers every pattern that matters.
2. The VWAP Bounce (Long)
The bounce is also a long, but the structure is different from the reclaim. Here the stock is already established above VWAP, the trend is already proven, and price pulls back to the first clean touch of the line and holds. You are not waiting for a sentiment flip. You are buying support inside an existing uptrend.
Real trade, June 5, 2026: CL. Colgate-Palmolive, a defensive large cap that moves in an orderly way, drove up off the open and established cleanly above VWAP. Buyers were in control. It pulled back into the first clean touch of VWAP, held right at the line, and resumed the trend up to 88 and above. The case here was simple and strong: established trend, rising VWAP, holding support, trading with the trend. First clean touch from above, when the trend is already proven, is one of the highest-quality long entries there is. You are not chasing and you are not guessing a bottom.
3. The VWAP Fade (Short)
The fade is the short side, and it is a setup we run every single day on stocks we want to short. It starts top down, with the daily chart and the underlying sector as the guide, not with the five-minute chart.
Real trade, June 5, 2026: NVTS. I wanted to short Navitas Semiconductor because the semiconductor sector, tracked by SMH, was rolling over. That is the top-down thesis: weak sector, weak daily, find the short candidate inside the group. After the opening flush, NVTS popped back up into VWAP. When I got a red candle to hold at the line, I took it short to play the breakdown. It cracked VWAP, the 9 EMA, and the 20 EMA, and knifed down more than 12 percent on the day.
Here is the edge most traders miss. The crowd shorts the low of day, which is late and obvious. We anticipate the breakdown of the low of day by shorting the VWAP rejection instead. Better price, defined risk against the line, and we are positioned before the obvious break happens. This top-down approach pairs with how I hunt for the right names in the scan for explosive stocks process.
4. The Failed Reclaim (The One Nobody Teaches)
Every other VWAP guide teaches the three setups that work and pretends the fourth does not exist. That is dishonest, and it gets new traders blown up. The failed reclaim is a named part of my system because it happens, and how you handle it is what keeps you in business.
Real trade, June 5, 2026: HOOD. Robinhood had a great daily chart and a strong trend day the day before. Two good reasons to like it long. It gapped down at the open and reclaimed VWAP, so I added on the reclaim with an entry at 85.25 and a stop at 84.99. That is a 26-cent risk, tight and defined. It popped about a dollar, then stalled right into the 20 EMA, the overhead resistance, and broke back under VWAP. I got out for a small loss, about 25 cents.
The tell was the overhead 20 EMA. The reclaim ran straight into resistance instead of into open space, and that is the difference between AAOI running and HOOD failing on the exact same day with the exact same setup. The case looked good but the evidence conflicted: there was overhead structure that the reclaim could not clear. Right process, wrong outcome, tiny loss, move on. There is no shame in a 25-cent loss when you sized it right and respected your stop. That is the whole game.
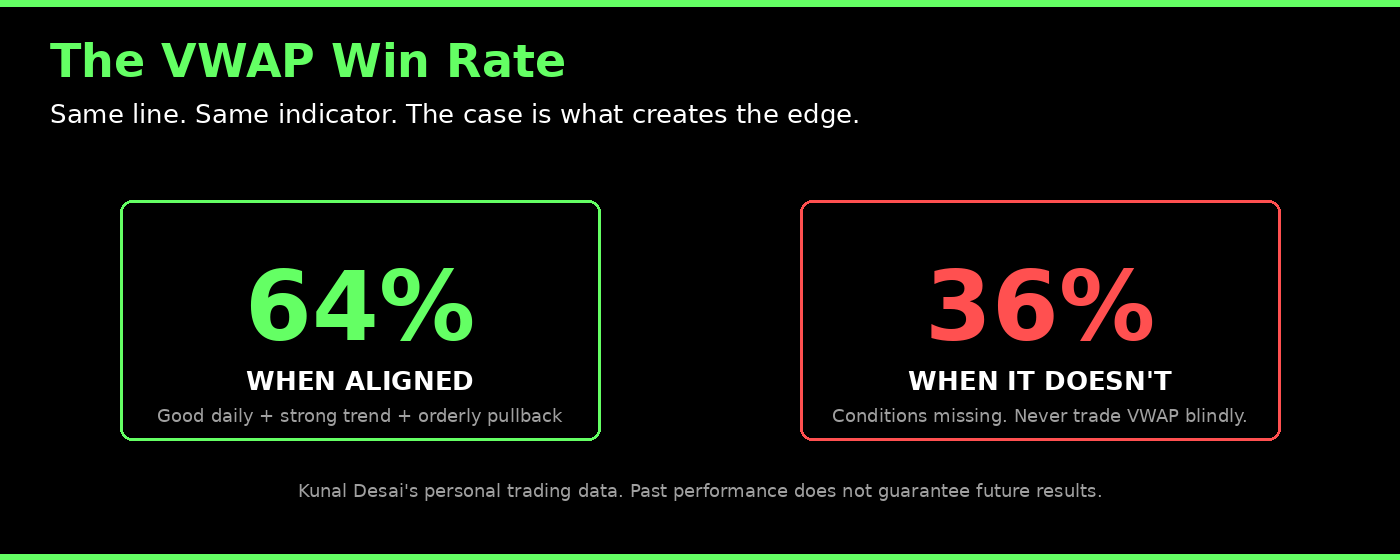
The VWAP Win Rate: 64% vs 36%
People search for VWAP win rate studies and get fantasy numbers from blogs trying to sell them something. Here is my real data, from my own trading. On VWAP trades where everything aligns, a good daily chart, a strong trend in the morning, and orderly pullbacks, I run a 64 percent win ratio. When those conditions are not present, that drops to 36 percent.
Read that again, because it is the entire point of this guide. Same line. Same indicator. Nearly double the win rate, depending entirely on whether the case is built. The VWAP does not have an edge. The case has the edge. That is exactly why you never use the indicator blindly. The 64 percent is what the Lawyer Framework earns you. The 36 percent is what happens when you skip the evidence and just trade the line because it is there.
This is personal trading data and your results will differ. Past performance does not guarantee future results, and every one of these setups fails regularly even when graded perfectly. That is why position sizing and stops matter as much as entries, which is the focus of the risk to reward ratio guide and the broader risk management framework.
VWAP and the Bone Zone: Reading Confluence
The Bone Zone is the shaded area between the 9 EMA and the 20 EMA on a 5-minute chart. It is one of my core differentiators, and it works hand in hand with VWAP. When price pulls back into the Bone Zone on decreasing volume and then prints a green candle, that is a high-quality entry trigger. When VWAP sits inside or near the Bone Zone, you have confluence: two independent reference points agreeing on the same level. That is more evidence for the case.
The HOOD trade is the warning side of this. The reclaim failed because the 20 EMA, the top of the Bone Zone, was sitting right overhead as resistance. When the Bone Zone is above price on a long, it is a ceiling, not a floor. Reading whether the Bone Zone is supporting or capping price is a fast way to know if your VWAP setup has room to run or is walking into a wall.
How to Set Up VWAP on Your Chart
I run all of my scanning and charting on TC2000, which has VWAP built in along with the moving averages I use for the Bone Zone. You can add VWAP as an indicator and overlay the 9 and 20 EMA on a 5-minute chart in a couple of clicks. If you want the exact layout I trade from, you can get TC2000 here and load my scan and chart templates. The setup is simple. The application is what takes reps.
Watch the Setups Live
Reading about these setups is one thing. Seeing them play out on real charts with real money is another. I break down trades like these every morning, and you can watch full setup walkthroughs on the Bulls on Wall Street YouTube channel.
Common VWAP Mistakes That Cost Traders Money
Trading VWAP as a standalone signal. The biggest one, covered above. VWAP is evidence, not a verdict. No case, no trade. Buying the first touch before it proves support. On a reclaim you wait for the green candle to hold. Blindly buying every touch gets you stopped out when price knifes through. Ignoring the slope. Taking longs on a falling VWAP or shorts on a rising one is fighting the current. Ignoring overhead structure. The HOOD lesson. A reclaim into an overhead 20 EMA has no room. Shorting the obvious low of day instead of anticipating the break at VWAP. Late and crowded beats nothing, but anticipating the breakdown at the VWAP rejection is a better price with defined risk. Sizing wrong. A 10-cent stop on a stock moving 50 cents a minute is a donation. Match your stop to the stock, not to your hope.
FAQ: VWAP for Day Trading
What is the best VWAP setup for day trading? There is no single best setup. The reclaim, bounce, and fade each fit different conditions. The reclaim works when a stock under VWAP flips sentiment and reclaims the line on a daily breakout. The bounce works when an established uptrend pulls back to the first clean touch. The fade works on the short side when the sector and daily are rolling over. The right setup is the one where the full case is present.
What is a good VWAP win rate? In my own trading, VWAP setups run about 64 percent when the daily chart, morning trend, and pullback structure all align, and about 36 percent when they do not. The win rate is a function of the case you build, not the indicator itself. Treat any blog claiming a fixed magic win rate with skepticism.
What is a VWAP reclaim? A VWAP reclaim is when a stock trading below VWAP breaks back above it and holds, confirmed by a green candle. It signals that the average market participant has flipped from underwater to profitable, which changes behavior from selling rallies to buying dips.
What is the difference between a VWAP reclaim and a VWAP bounce? A reclaim happens when price is below VWAP and breaks back above it, a sentiment flip. A bounce happens when price is already above VWAP in an established uptrend and pulls back to the first clean touch of the line as support. Reclaim is under and back over. Bounce is touch from above.
What is a VWAP fade? A VWAP fade is a short setup where a stock pops up into VWAP after an opening flush and gets rejected with a red candle holding at the line. It works best when the underlying sector and daily chart are rolling over, letting you anticipate the breakdown of the low of day rather than chasing it.
Does VWAP reset each trading day? Yes. For day trading, VWAP resets every morning at the open and rebuilds throughout the session as volume accumulates. This intraday reset is why VWAP is the most important reference line for day traders specifically.
Is VWAP a leading or lagging indicator? VWAP is a lagging reference because it is built from price and volume that have already traded. Its value is not prediction. It is showing you the level the market collectively cares about right now, which is why it acts as support and resistance.
Should I use VWAP by itself? No. Using VWAP as a standalone buy or sell signal is the single biggest mistake new traders make. VWAP is one piece of evidence. You need a named price pattern, real volume, alignment with moving averages, and the trend behind it before VWAP confirmation means anything.
What timeframe should I use VWAP on for day trading? The 5-minute chart is my primary timeframe for intraday VWAP setups, with the 9 and 20 EMA overlaid for the Bone Zone. The daily chart sets the thesis and direction before you ever look at the 5-minute.
Why do institutions use VWAP? Institutions are benchmarked against VWAP because execution desks have a best-execution duty to fill large orders at favorable average prices. Their performance is graded on whether they beat VWAP, which is why their algorithms trade around it and why the line becomes self-reinforcing support and resistance.
Does VWAP work on low-float and small-cap stocks? VWAP works best on liquid stocks with real participation, where enough volume trades for the average to be meaningful. On thin, illiquid names the line is far less reliable because there is not enough collective activity behind it.
What is the failed reclaim and why does it matter? A failed reclaim is when a stock reclaims VWAP but cannot hold and breaks back under, often because of overhead resistance like the 20 EMA. It matters because pretending VWAP setups always work gets traders blown up. Naming the failure and respecting a tight stop is what keeps your account alive.
Bottom Line
VWAP is the most important line on a day trader's chart, but only because of what it represents: where the average participant sits right now. It is not a signal you obey. It is a witness you call to support a case you have already built from a price pattern, volume, moving averages, and trend. Build the case and the four setups, reclaim, bounce, fade, and the honest failed reclaim, become repeatable edges. Skip the case and you are flipping coins. The 64 versus 36 win rate is the proof. Move the needle, then pull the trigger.
If you want to learn this framework the way my students do, watch me trade these setups live every morning and get the full system, the 60-Day Bootcamp is where it all comes together. You can also watch me trade these exact setups in real time in the Bulls on Wall Street trading chatroom.
About the Author
Kunal Desai is the CEO and founder of Bulls on Wall Street. A professional trader since 2007, he has navigated every major market cycle, from the 2008 financial crisis to today's high-volatility environments. Having mentored 7,000+ students through his live trading bootcamps, Kunal trades live every morning in the Bulls on Wall Street Trading Chatroom and is dedicated to teaching real-world execution and high-probability strategies. Based in Miramar Beach, Florida.
Connect with Kunal: Read his full story | Instagram | YouTube