

March 2026
I have been trading since 1999. Full-time since 2007. Over 7,000 students trained through the 60-Day Live Trading Bootcamp. And if I had to name the one strategy that has made me the most money over the longest stretch of time? Pullbacks. Not breakouts. Pullbacks.
Breakouts are exciting. Everyone sees them at the same time. Everyone is buying the same candle. The risk-reward is already compressed because you are always buying something extended. Pullback trading flips that. You are buying strength that temporarily looks weak. You are getting in while everyone else is second-guessing themselves. When you do it right — the right level, the right volume confirmation, the right entry trigger — the risk is tight and the setup is precise.
This post covers everything. How I scan for setups. The three patterns I trade. The Bone Zone entry. When I use options versus stock. And a live trade on $NOW to show you exactly how the whole system works in real time.
Why Pullback Trading Works
Stocks do not go straight up. Never have. The pattern is always the same — a big thrust lasting three to seven trading days, then a pause to digest that move, then another thrust. I call this stair-stepping. Every professional trader I know trades some version of it.
That pause and pullback is where I want to be buying. When a stock is running hard, everyone is already long. Latecomers are chasing. Then it stalls, the latecomers get nervous, and selling pressure builds. Price pulls back to a key moving average. The early buyers average down. Fresh money enters on the dip. Sellers exhaust themselves. The stock coils. Then it goes again.
That sequence is repeatable, predictable, and tradeable. VWAP works the same way intraday — fair value acts as a magnet. On a swing trade timeframe, the 9 EMA and 20 EMA are your magnets.
The Three Swing Trading Pullback Setups
Four setups became three. The 20 EMA pullback and the Bone Zone are the same trade. Master these three and you have a complete system.
1. The 9 EMA Pullback
Bread and butter. Stock is in a clear uptrend, higher highs and higher lows, 9 EMA sloping up. It makes a move. Three to seven days later it is back at the 9 EMA on declining volume. When I get a green candle closing back above that level, I buy. Stop goes right under that candle. Tight, clean, no ambiguity.
2. The Bone Zone Entry
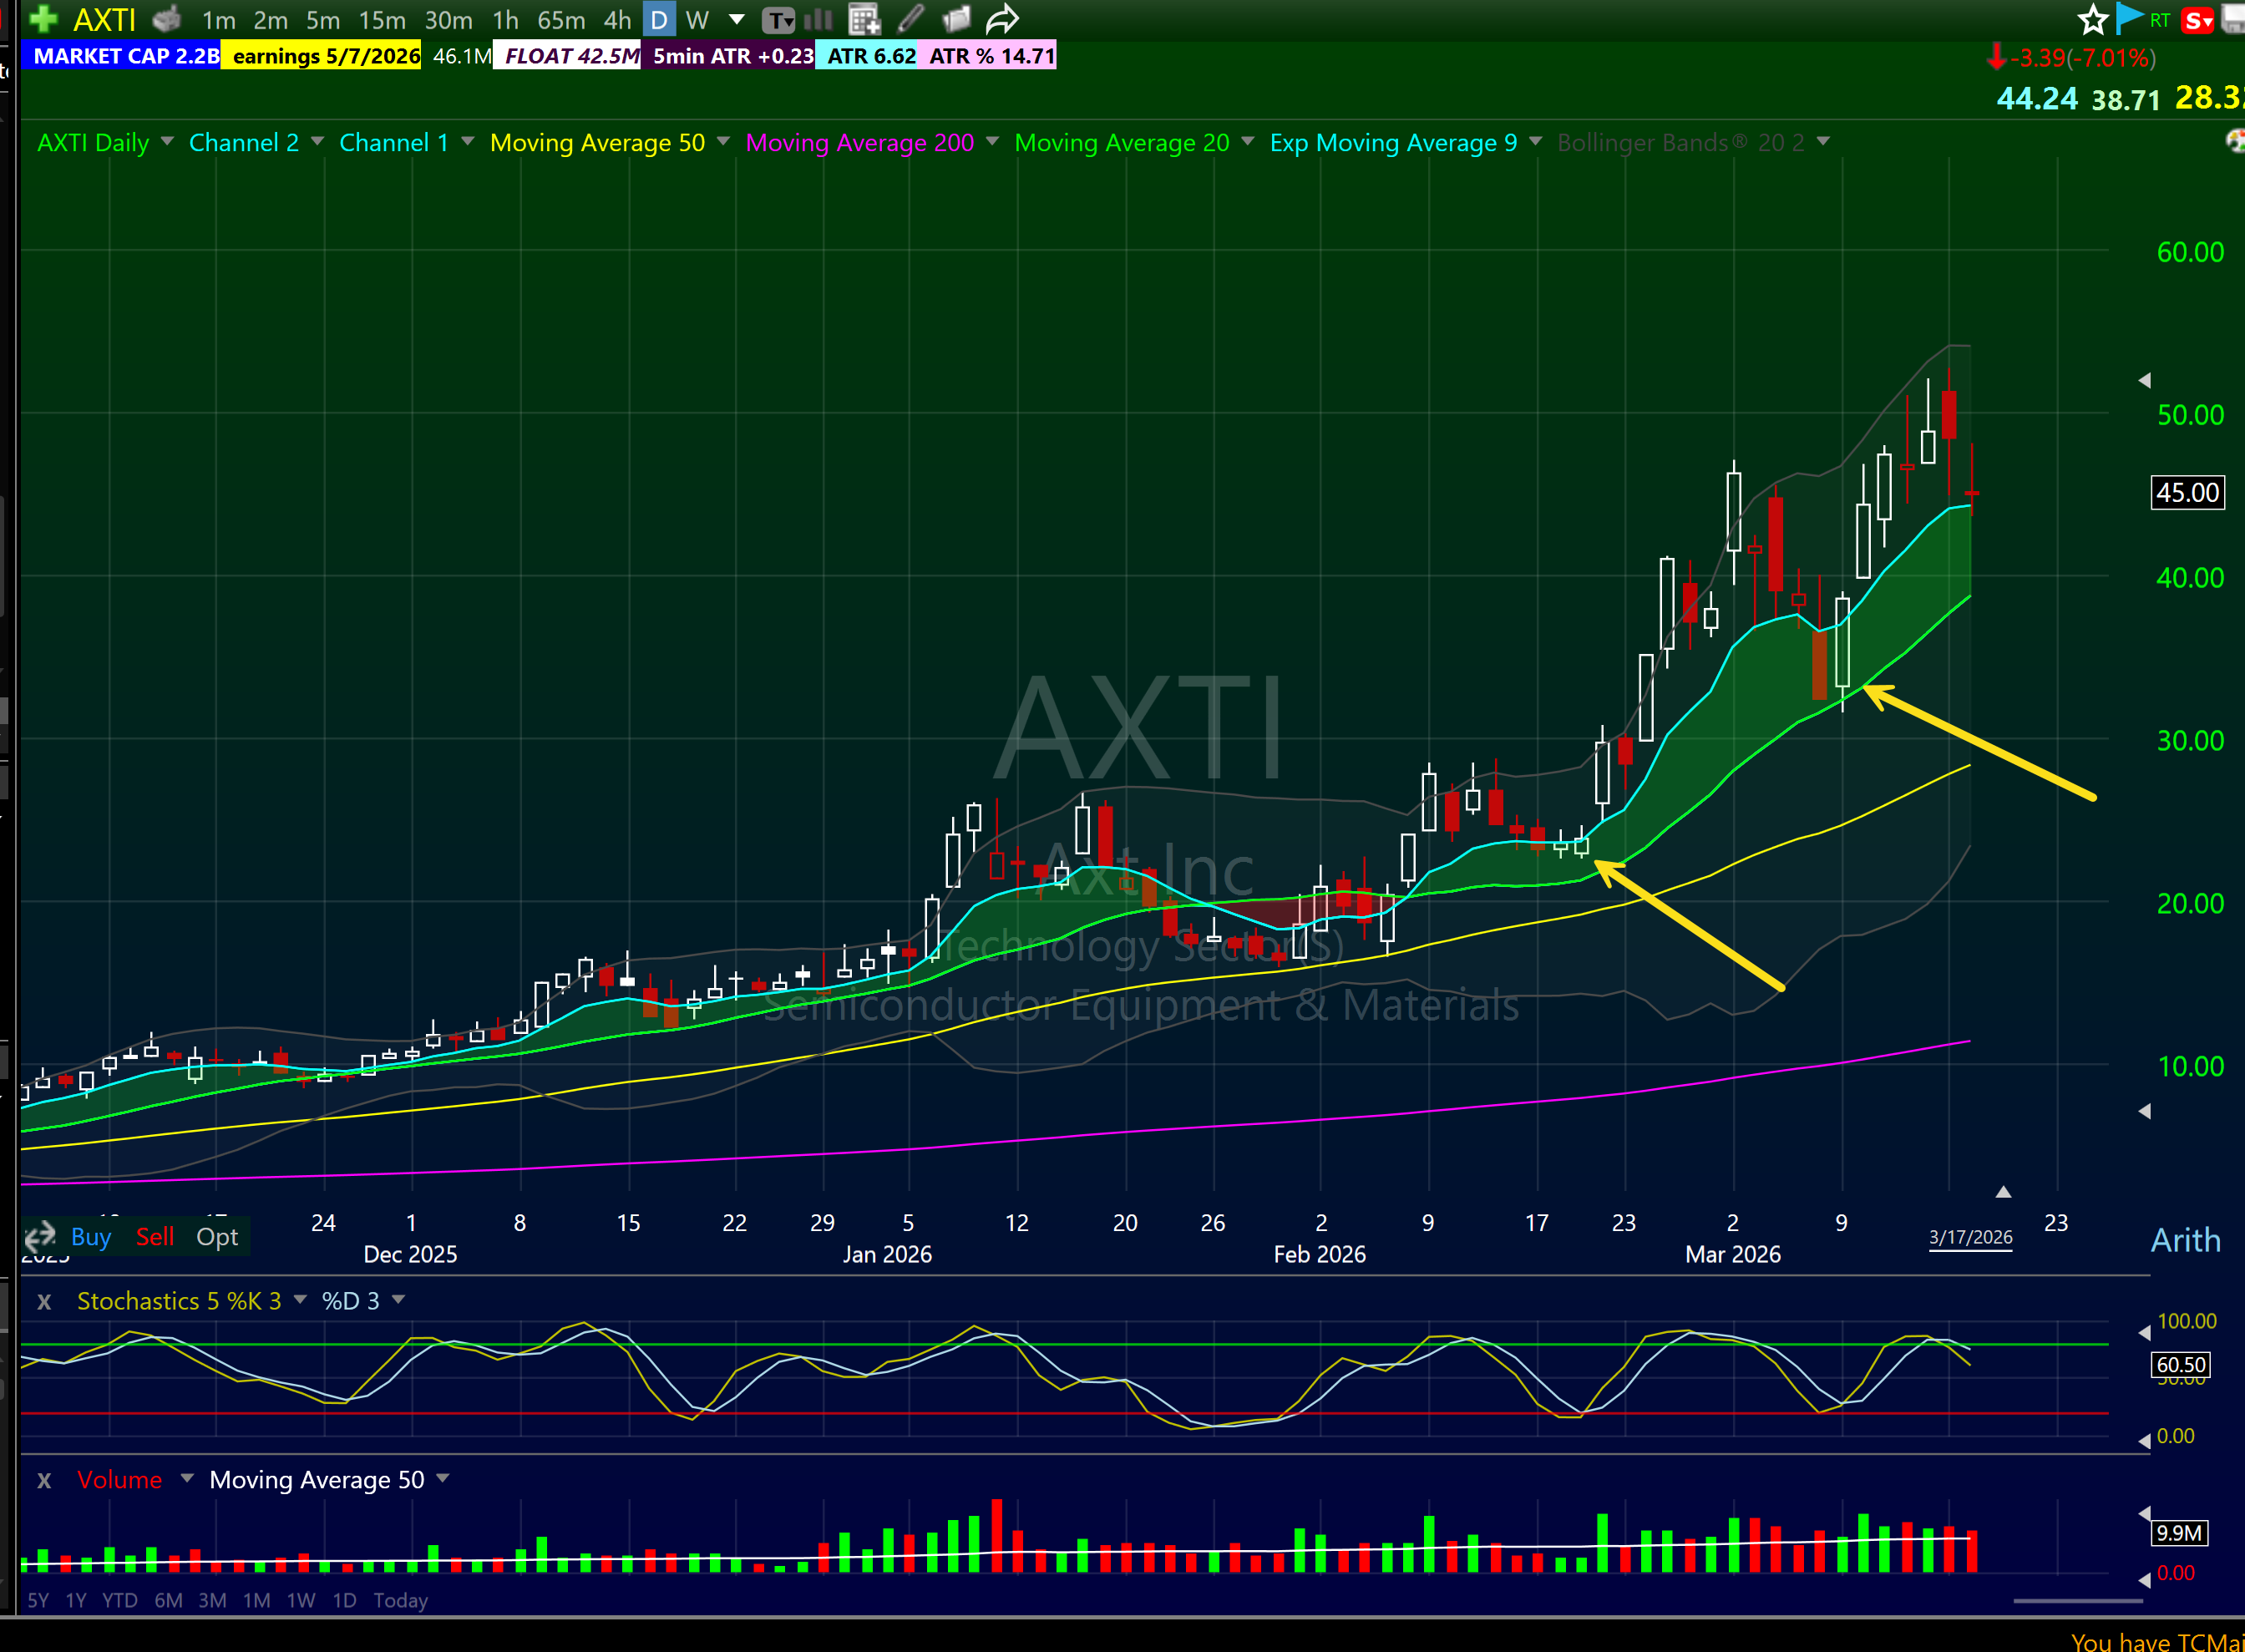
The Bone Zone is the shaded area between the 9 EMA and 20 EMA on the daily chart. My proprietary concept, and the most powerful entry I know for swing trades.
When a stock in an uptrend pulls back into that zone — dipping below the 9 EMA but still holding above the 20 EMA — and then prints a green candle closing back above the 9 EMA, the trade is on. You are buying at the exact moment the trend reasserts itself. Stop goes below the last swing low. Upside is typically the full prior thrust.
One rule before you touch this entry: the zone must be GREEN. Green Bone Zone means uptrend. When it flips red, meaning the 9 EMA crosses below the 20 EMA, you stop trading pullbacks and wait for the 50 SMA. Trying to buy Bone Zone pullbacks in a red zone is how traders get chopped up.
$AXTI showed this pattern twice on the way up. Both times the stock pulled back into the green zone on light volume, printed a confirmation candle, and launched. The second entry near $30-35 ran all the way to nearly $45.
If you want the Bone Zone Layout feel free to download it!
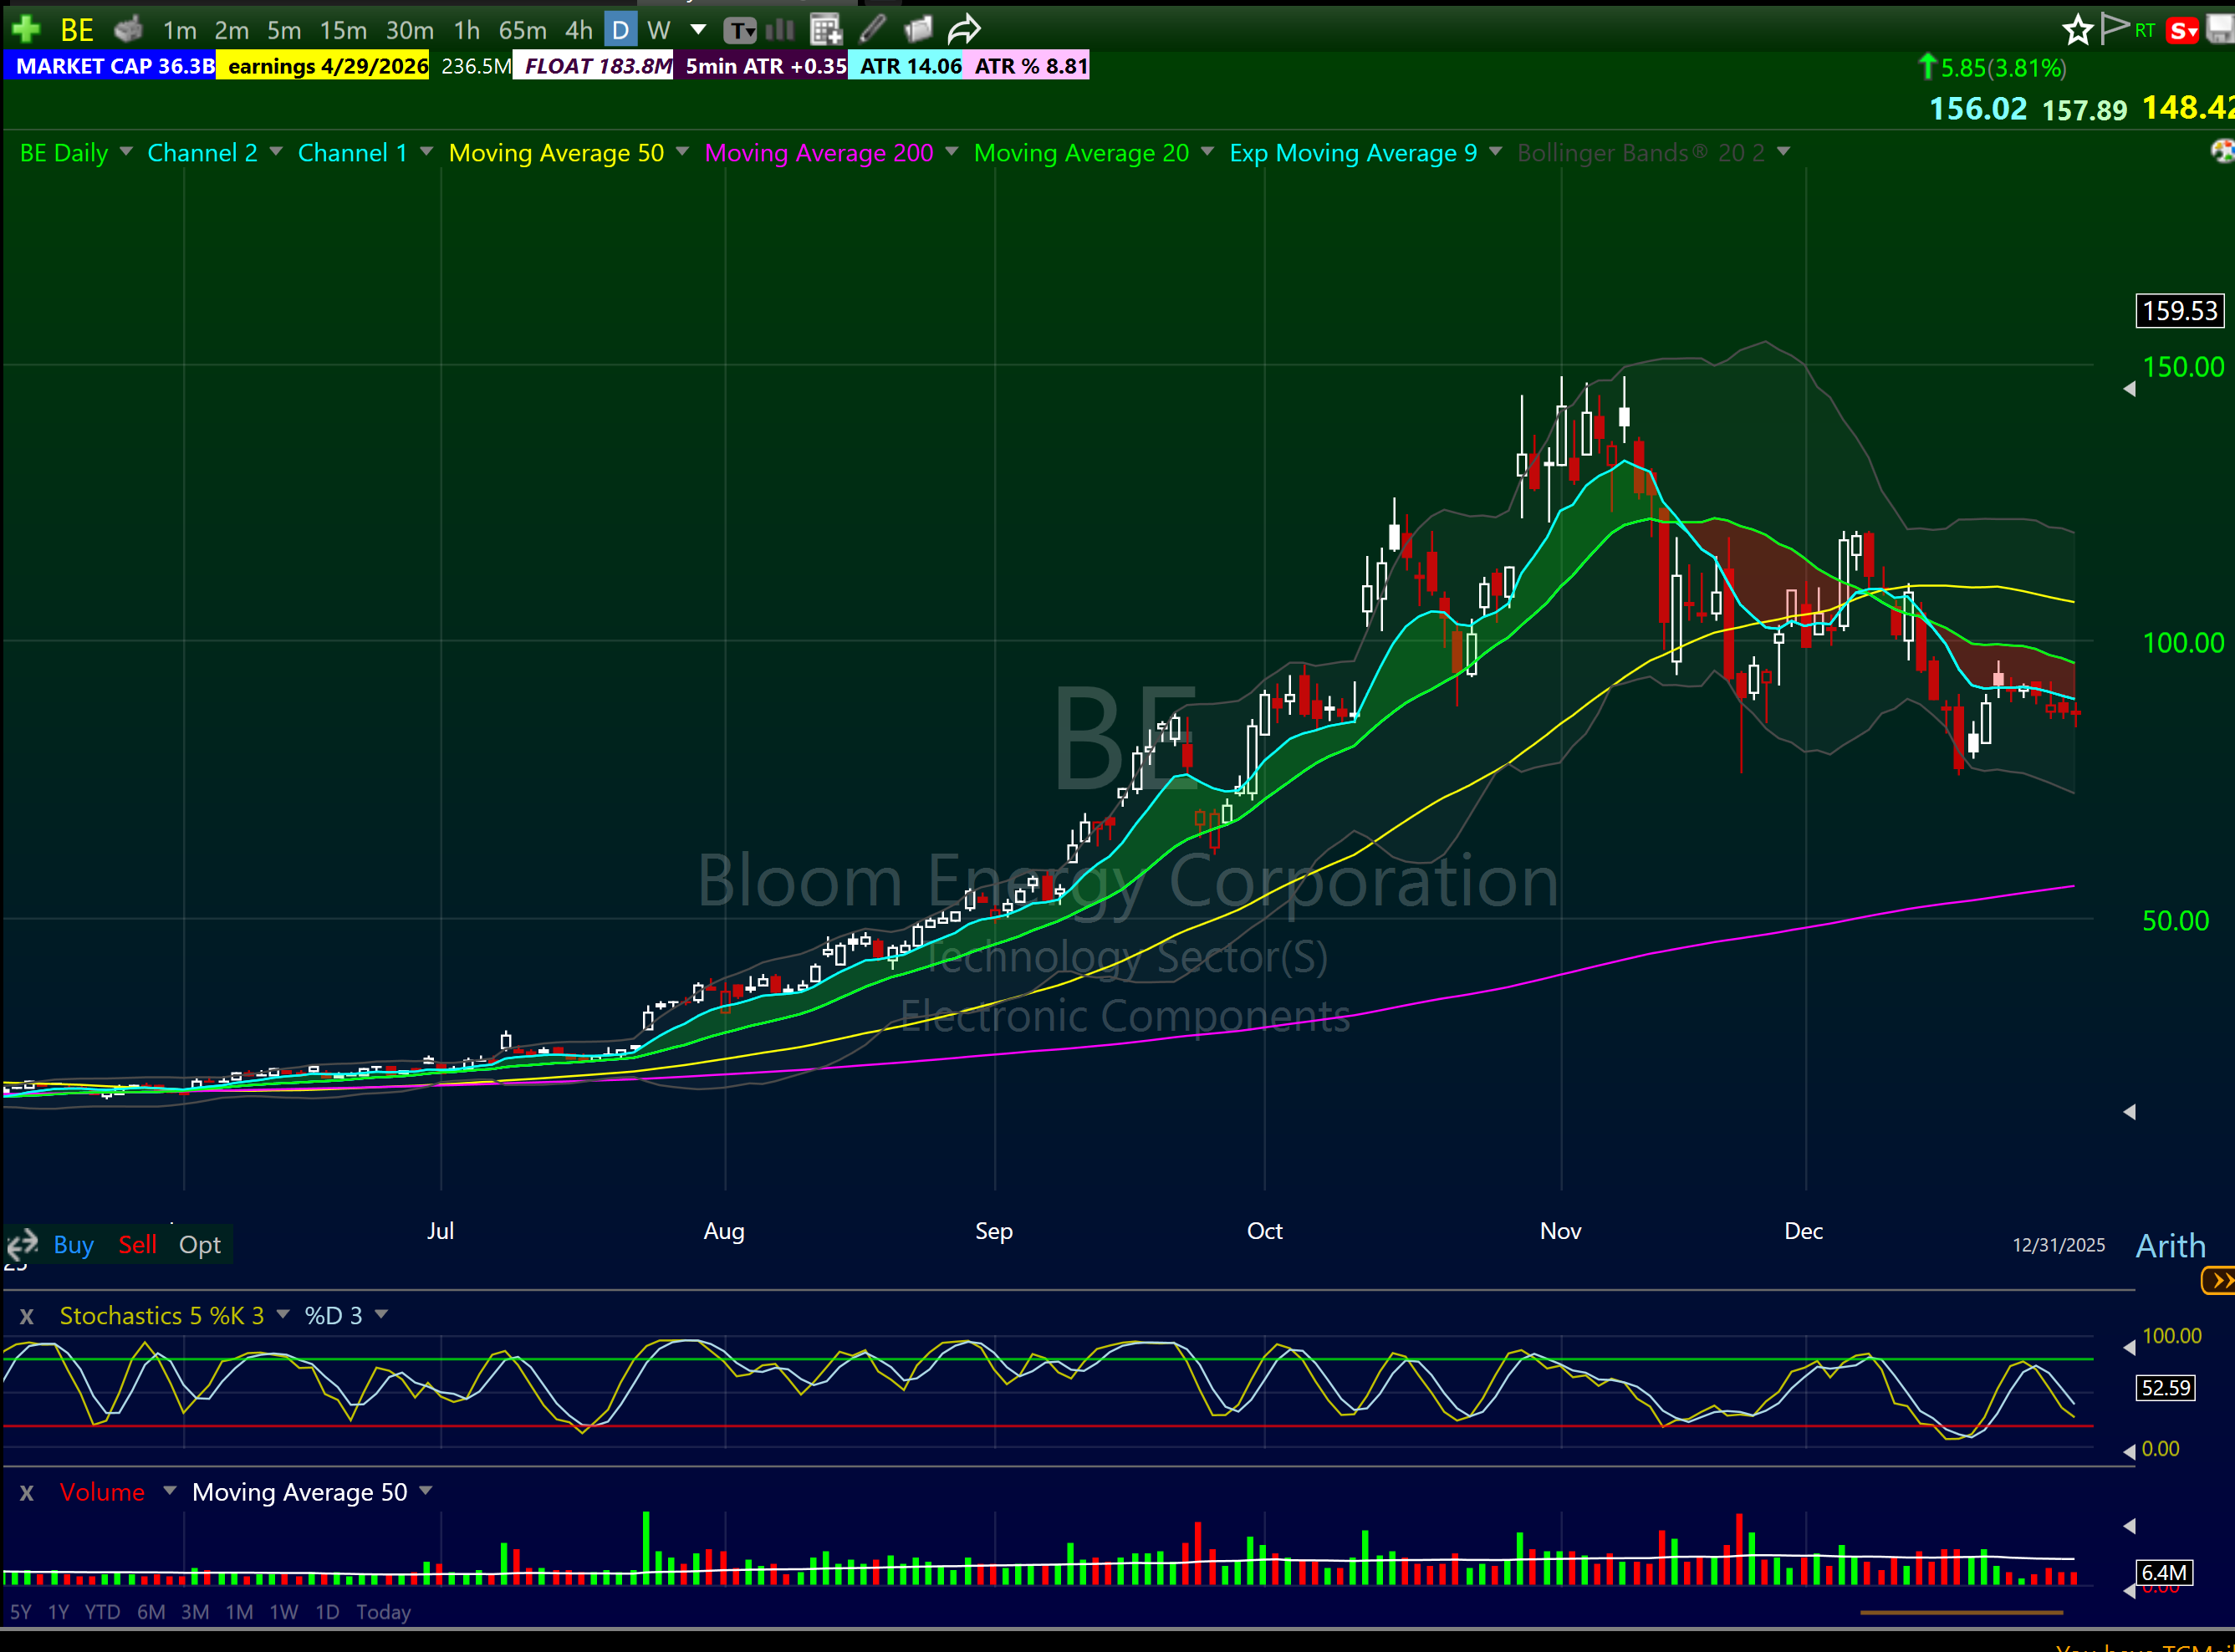
$BE (Bloom Energy) is the more dramatic example. Four to five Bone Zone entries as the stock ran from the teens to $160. Every single one launched the next leg. Then the zone flipped red near the top. The traders who kept buying pullbacks in a red zone got stuck. The ones who respected the flip got out.
3. Pullback in a Base Breakout
Covered base breakouts in detail in my first pullback trading strategy post. The specific application here: when a stock breaks out of a multi-week or multi-month base and then pulls back to the breakout level, testing old resistance as new support, that is one of the highest-probability entries in swing trading. The stock already declared its intent. Now it is giving you a second chance. Load up.
Fresh Trend vs Tired Trend: Which Level to Use
Most traders stare at a chart and wonder: do I buy the 9 EMA or wait for something deeper? The answer is not about the chart. It is about where the stock is in its trend.
Fresh trend, just broke out of a base — buy the 9 EMA. The move is new, the EMAs are still close to price, and the stock does not need much rest before the next leg. Clean 9 EMA pullback on light volume. That is your spot.
A few weeks in, trend is maturing — the Bone Zone is your entry. Price has traveled far enough that a normal pullback slices through the 9 EMA. Healthy. Expected. When it holds the zone and reclaims the 9, that is the signal.
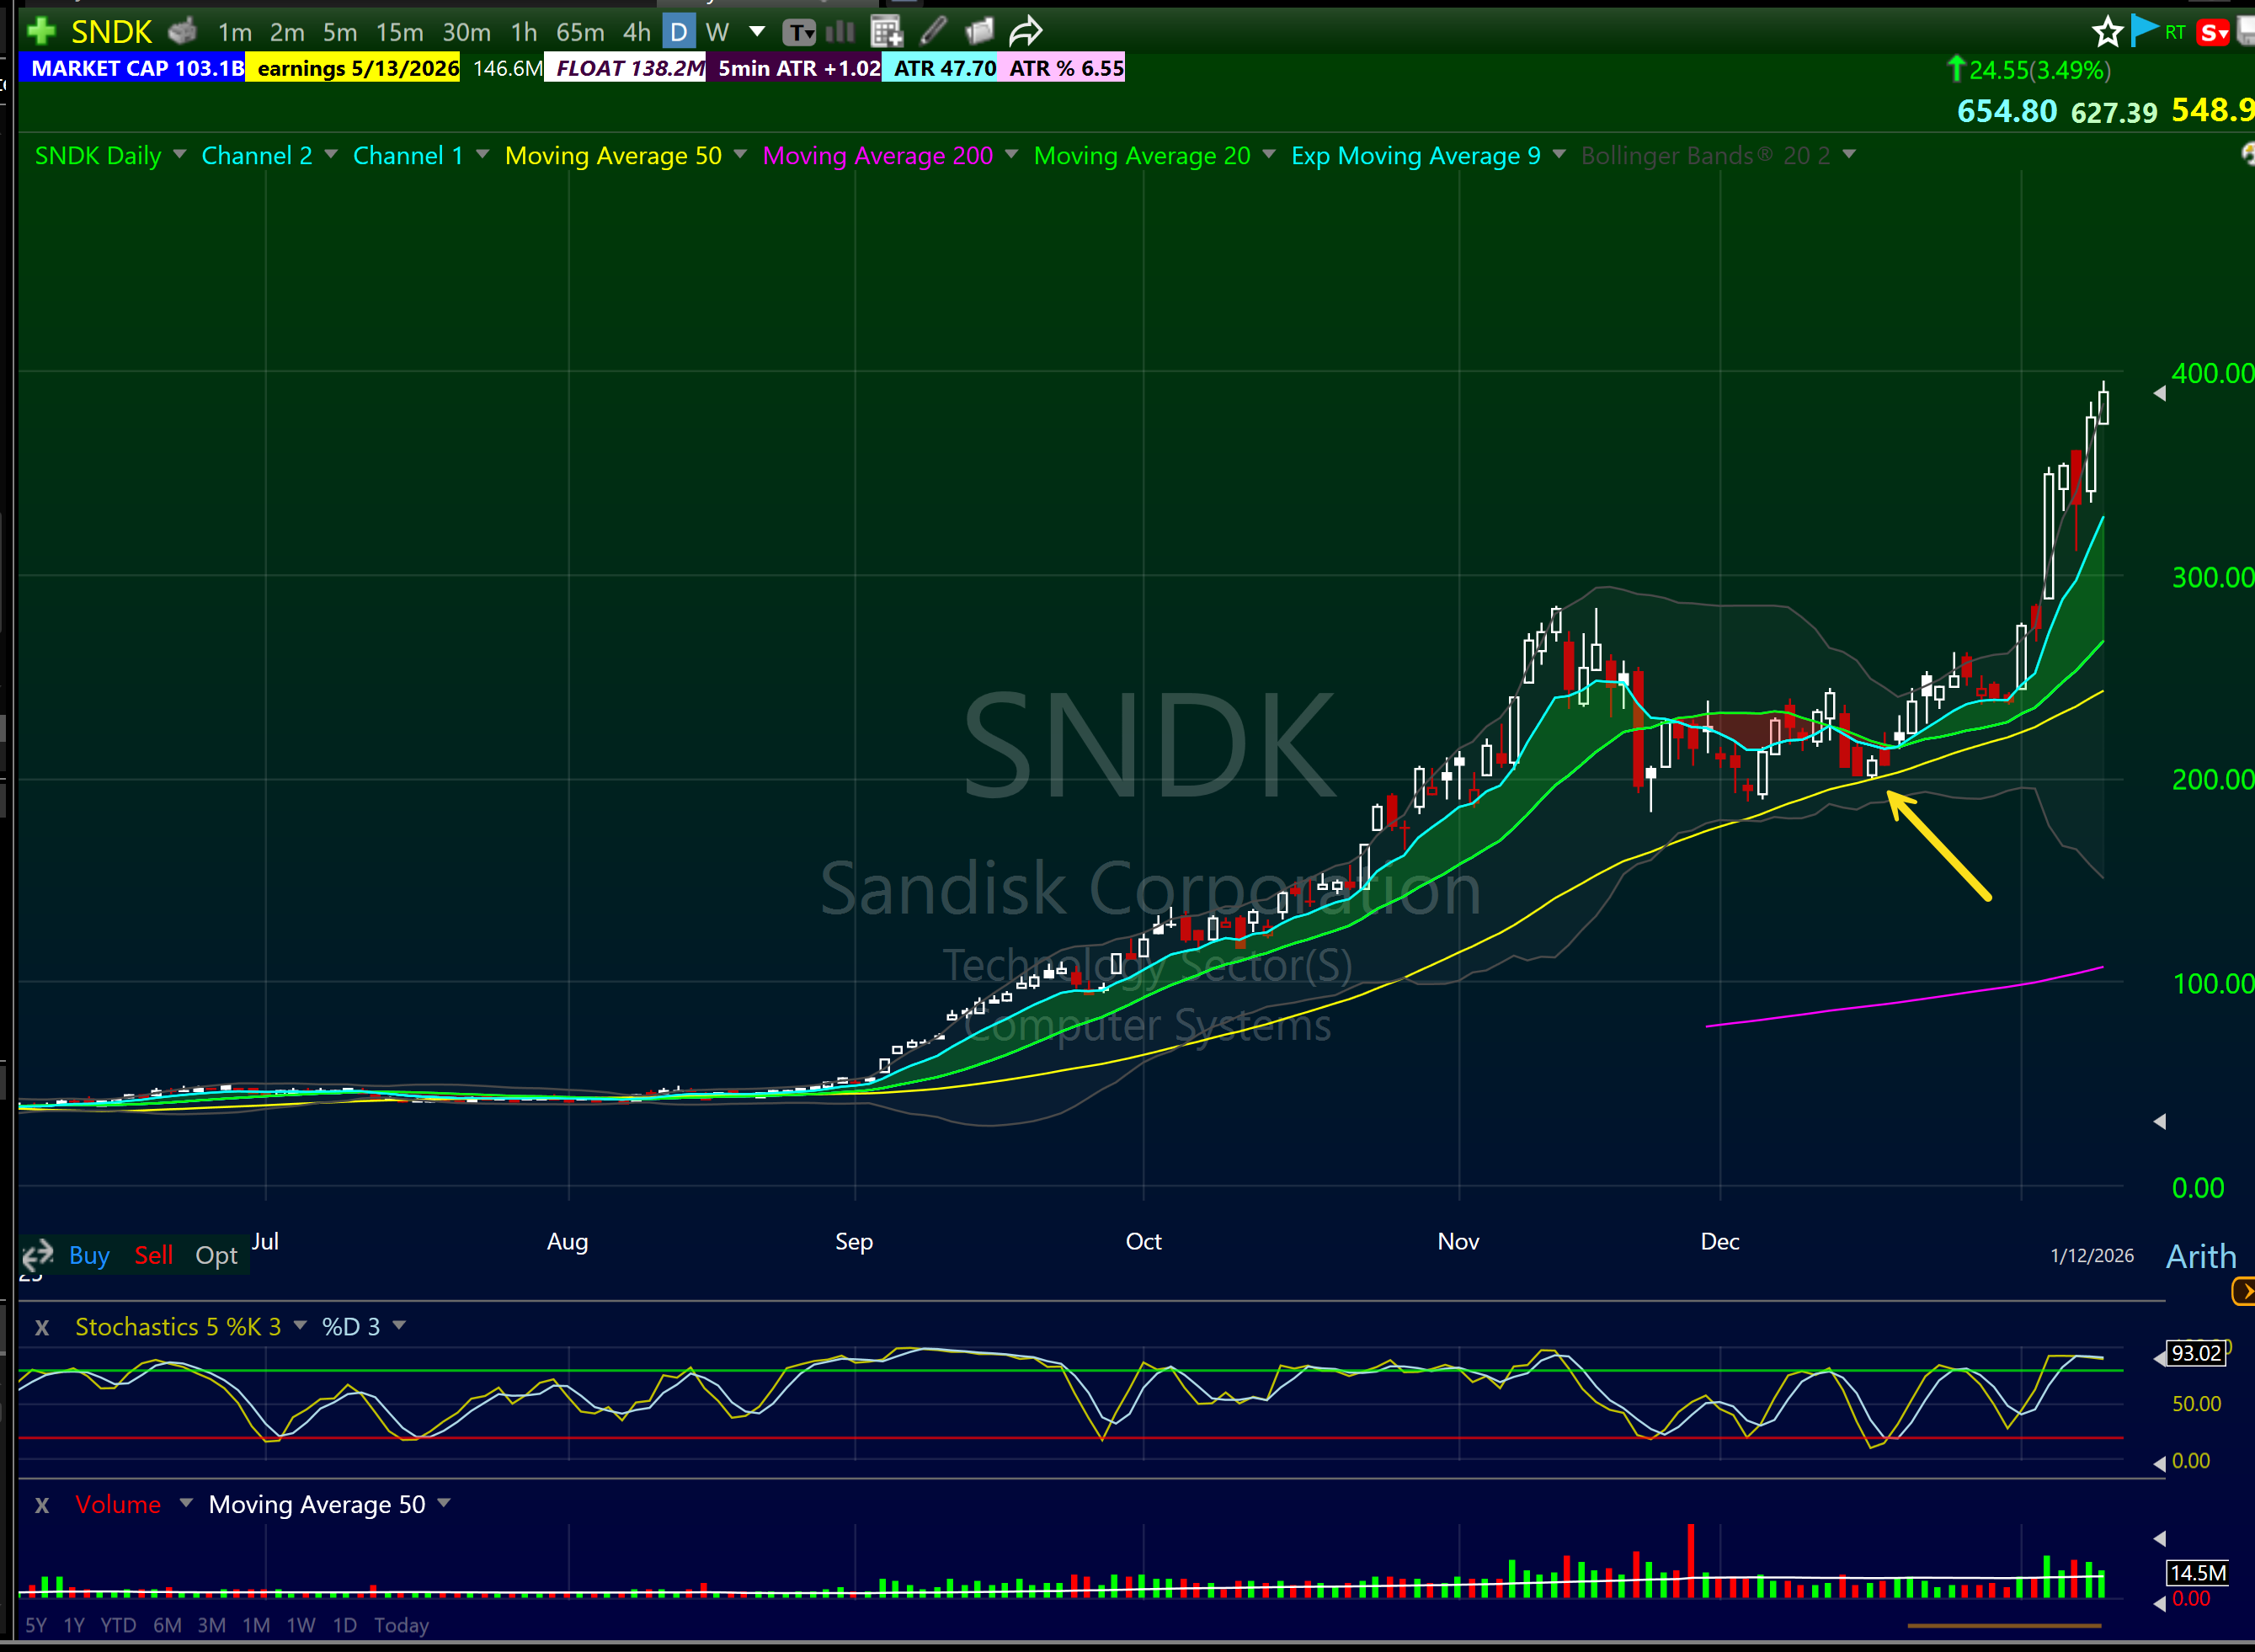
Running for months, stock is up 50-100 percent — wait for the 50 SMA. $SNDK ran from the $50s all the way past $600. By the time that stock had traveled hundreds of dollars, the 9 EMA and Bone Zone entries were noise. The 50 SMA pullback on declining volume was the re-entry. One of the cleanest entries of the entire run, and most traders missed it because they were waiting for a shallower dip that never came.
Fresh trend equals 9 EMA. Maturing trend equals Bone Zone. Extended long-running trend equals 50 SMA. Read the cycle, then pick the level.
The $NOW Trade: Real-Time Example
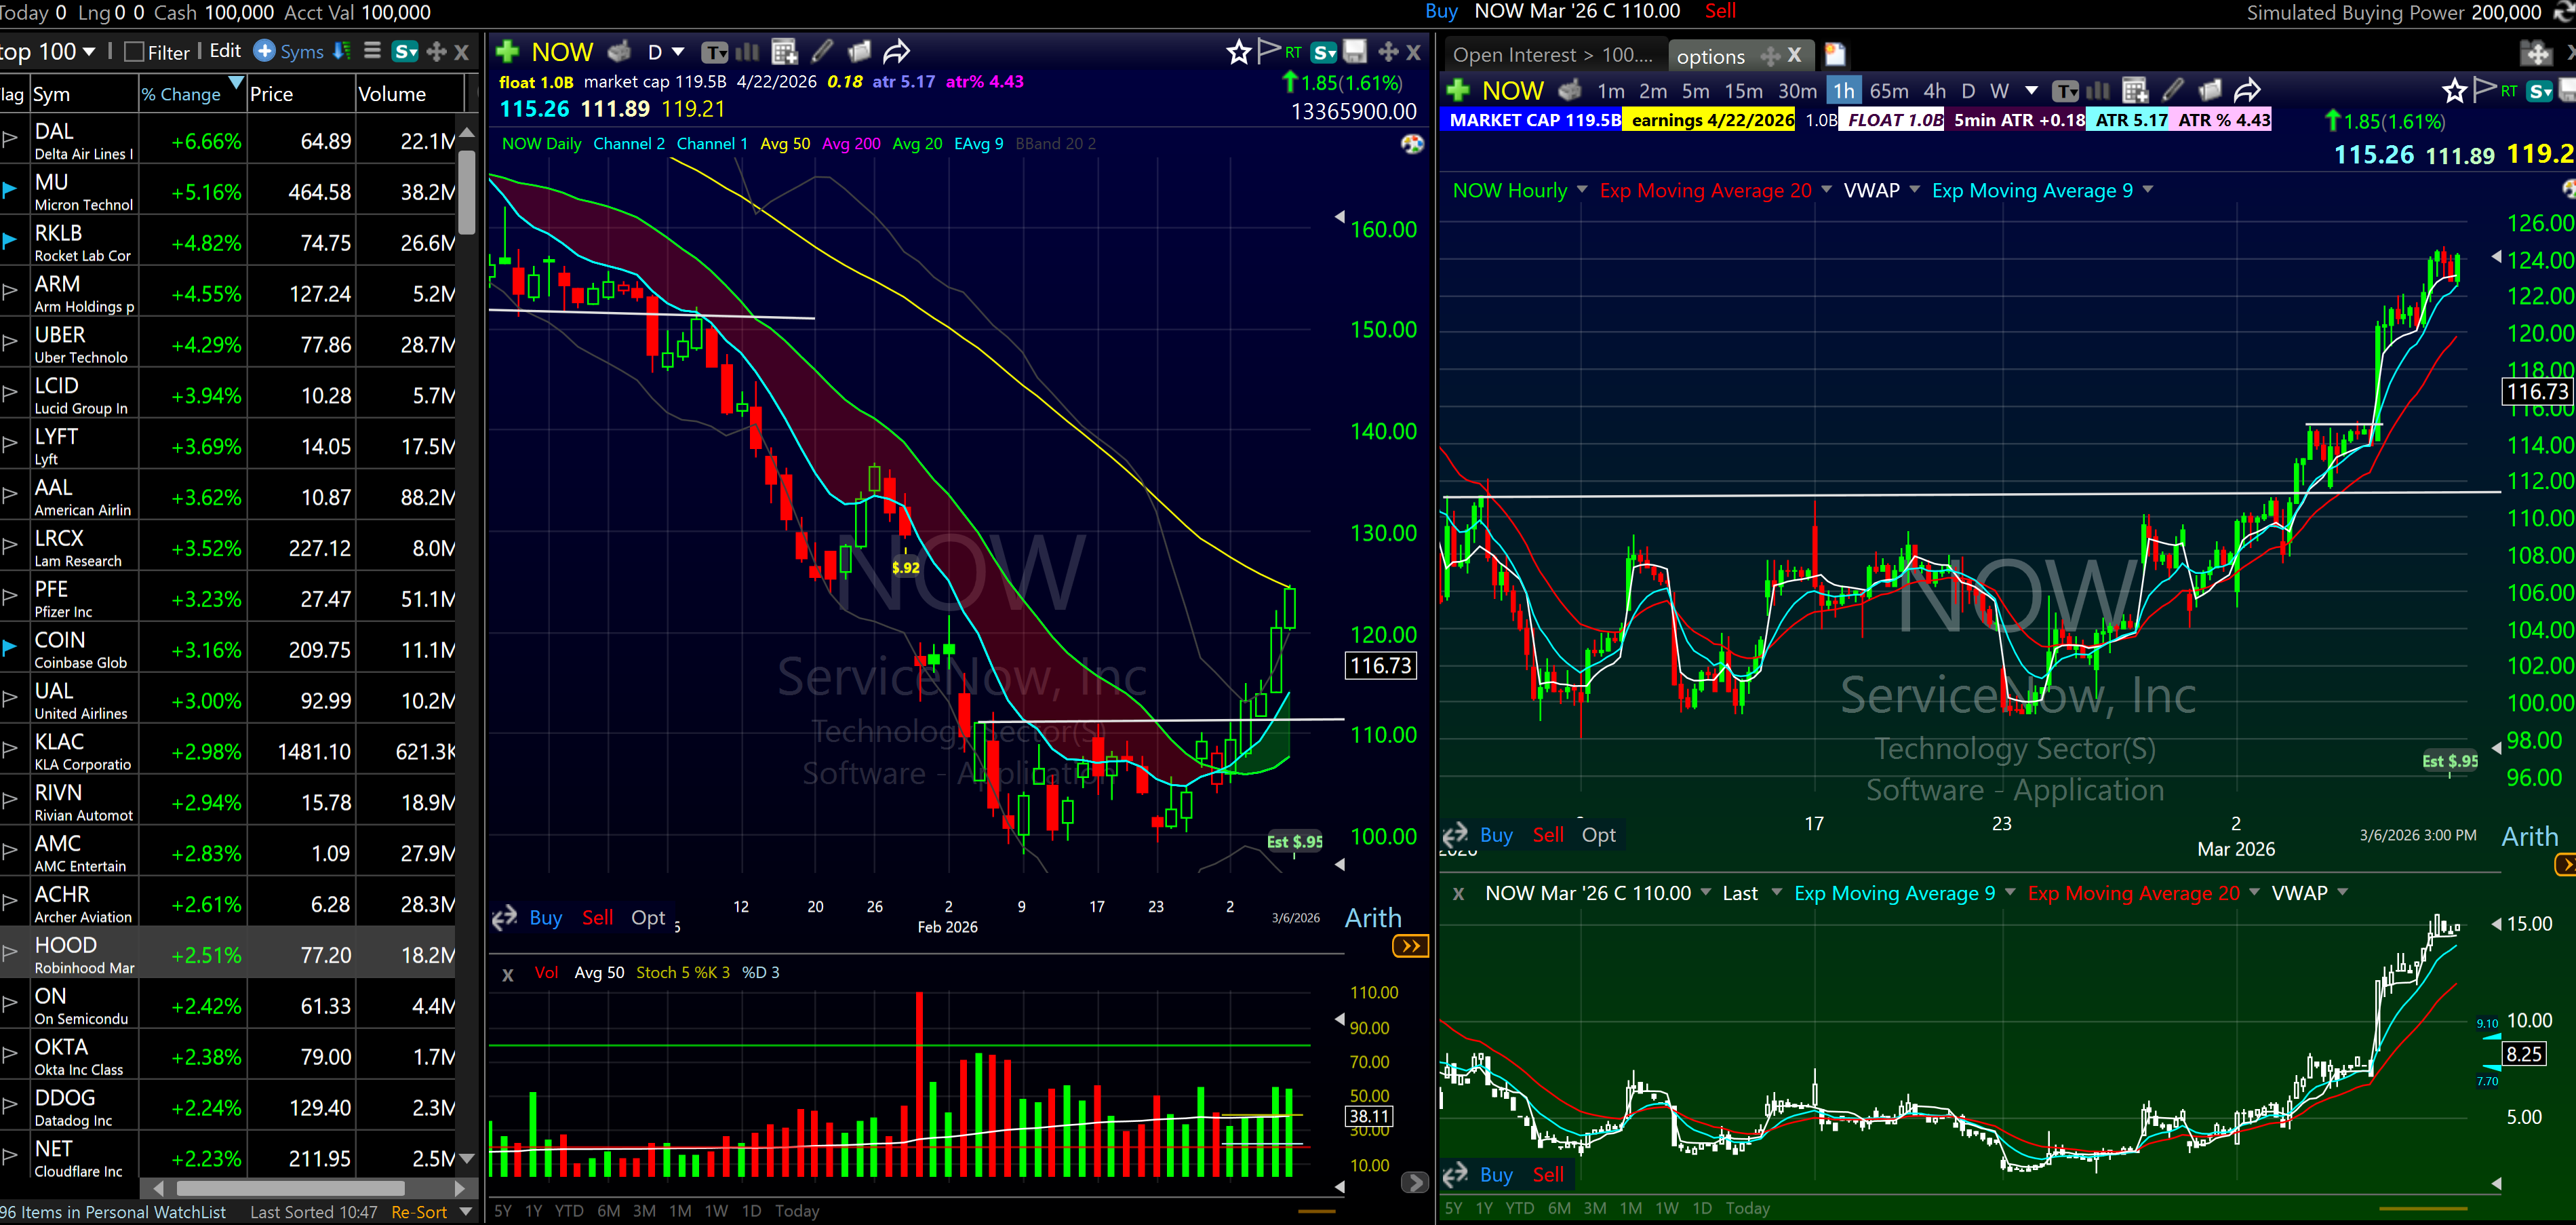
February 26. I bought the 110 calls on $NOW at $4.20 per contract.
My thesis: $NOW had been in a deep pullback and was starting to form a base. Classic base breakout setup at the 110 level. My read was that if it cleared 110 and held, there was a clear runway to the 50 SMA. Bigger picture — I thought this might be a permanent bottom. Institutions done distributing, now accumulating. When I see that setup with low implied volatility on the options, the math works.
Nine trading days later, those calls were at $14.78.
Position management from entry to March 7:
When the calls hit $7.00, I sold half. At that point I had covered my full initial risk. Playing with house money on the rest. Selling half at a double removes all financial stress from the remaining position — the trade becomes free.
When they pushed to $13.00 near the close, I trimmed another quarter. Now the last 25 percent has a cost basis at zero. Any gain from here is pure profit.
The remaining position rides until the thesis breaks. My stop is on the equity chart, not the option price. If $NOW closes back below the 50 SMA or breaks under the base level, I sell the option. The option price is irrelevant. I trade the stock chart and use the option as the vehicle.
Stair-step philosophy in action. No grand slam attempt. Captured the thrust, covered risk, trimmed into strength, let a free position breathe.
How I Scan for Swing Trades: The Top-Down Approach
Great setups do not fall in your lap. The process matters as much as the pattern recognition.
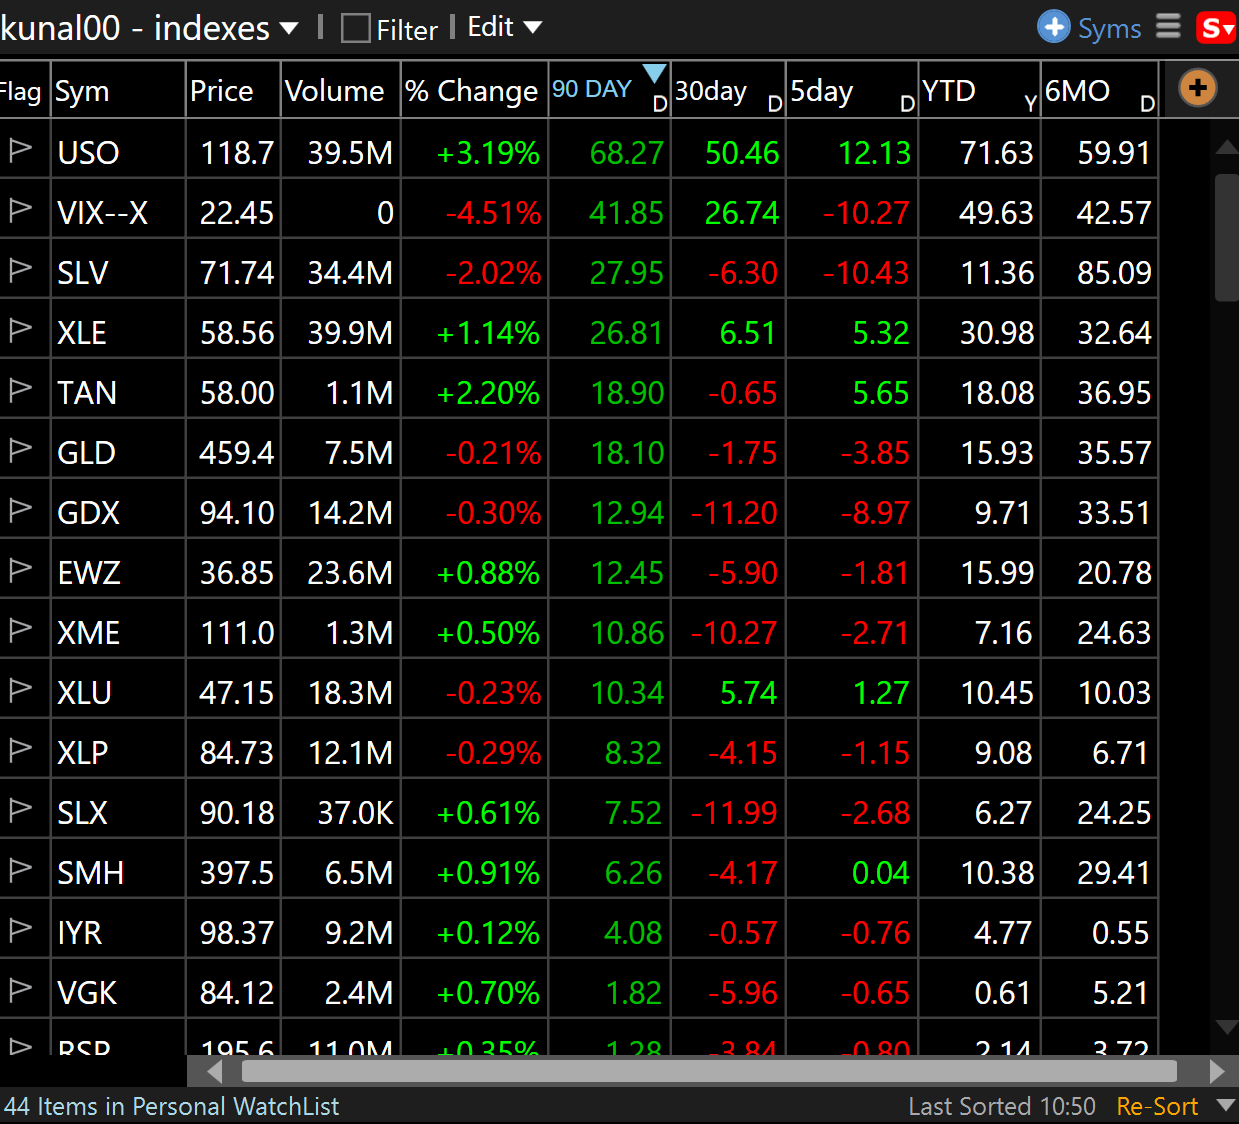
Step 1: The 40 ETF Index Scan
Every night I flip through 40 ETFs covering every major sector and market segment — energy, semiconductors, financials, biotech, small caps, international, you name it. Two things I am watching for: which indexes look ready to break out, and which are in strong trends pulling back to support.
When an index is doing one of those things, its components have a tailwind. Trading with sector strength dramatically improves your probability. Semiconductor ETF pulling back to the 9 EMA in an uptrend? Semiconductor stocks are your hunting ground. Top-down approach. Find the wind, then find stocks sailing with it.
Here is my full list in tc2000 if you want it. 40 ETF Index Scan
Step 2: Drill Into the Components
Once I identify a strong index, I go stock by stock through the components. Flat top breakout. Flag breakout. Base breakout. Bone Zone pullback. Pattern recognition. Fast and systematic.
TC2000 makes this efficient — watchlists organized by sector, flip through charts in a rhythm. If you are not using it for your swing scans, you are doing extra work for no reason. Check it out at TC2000.
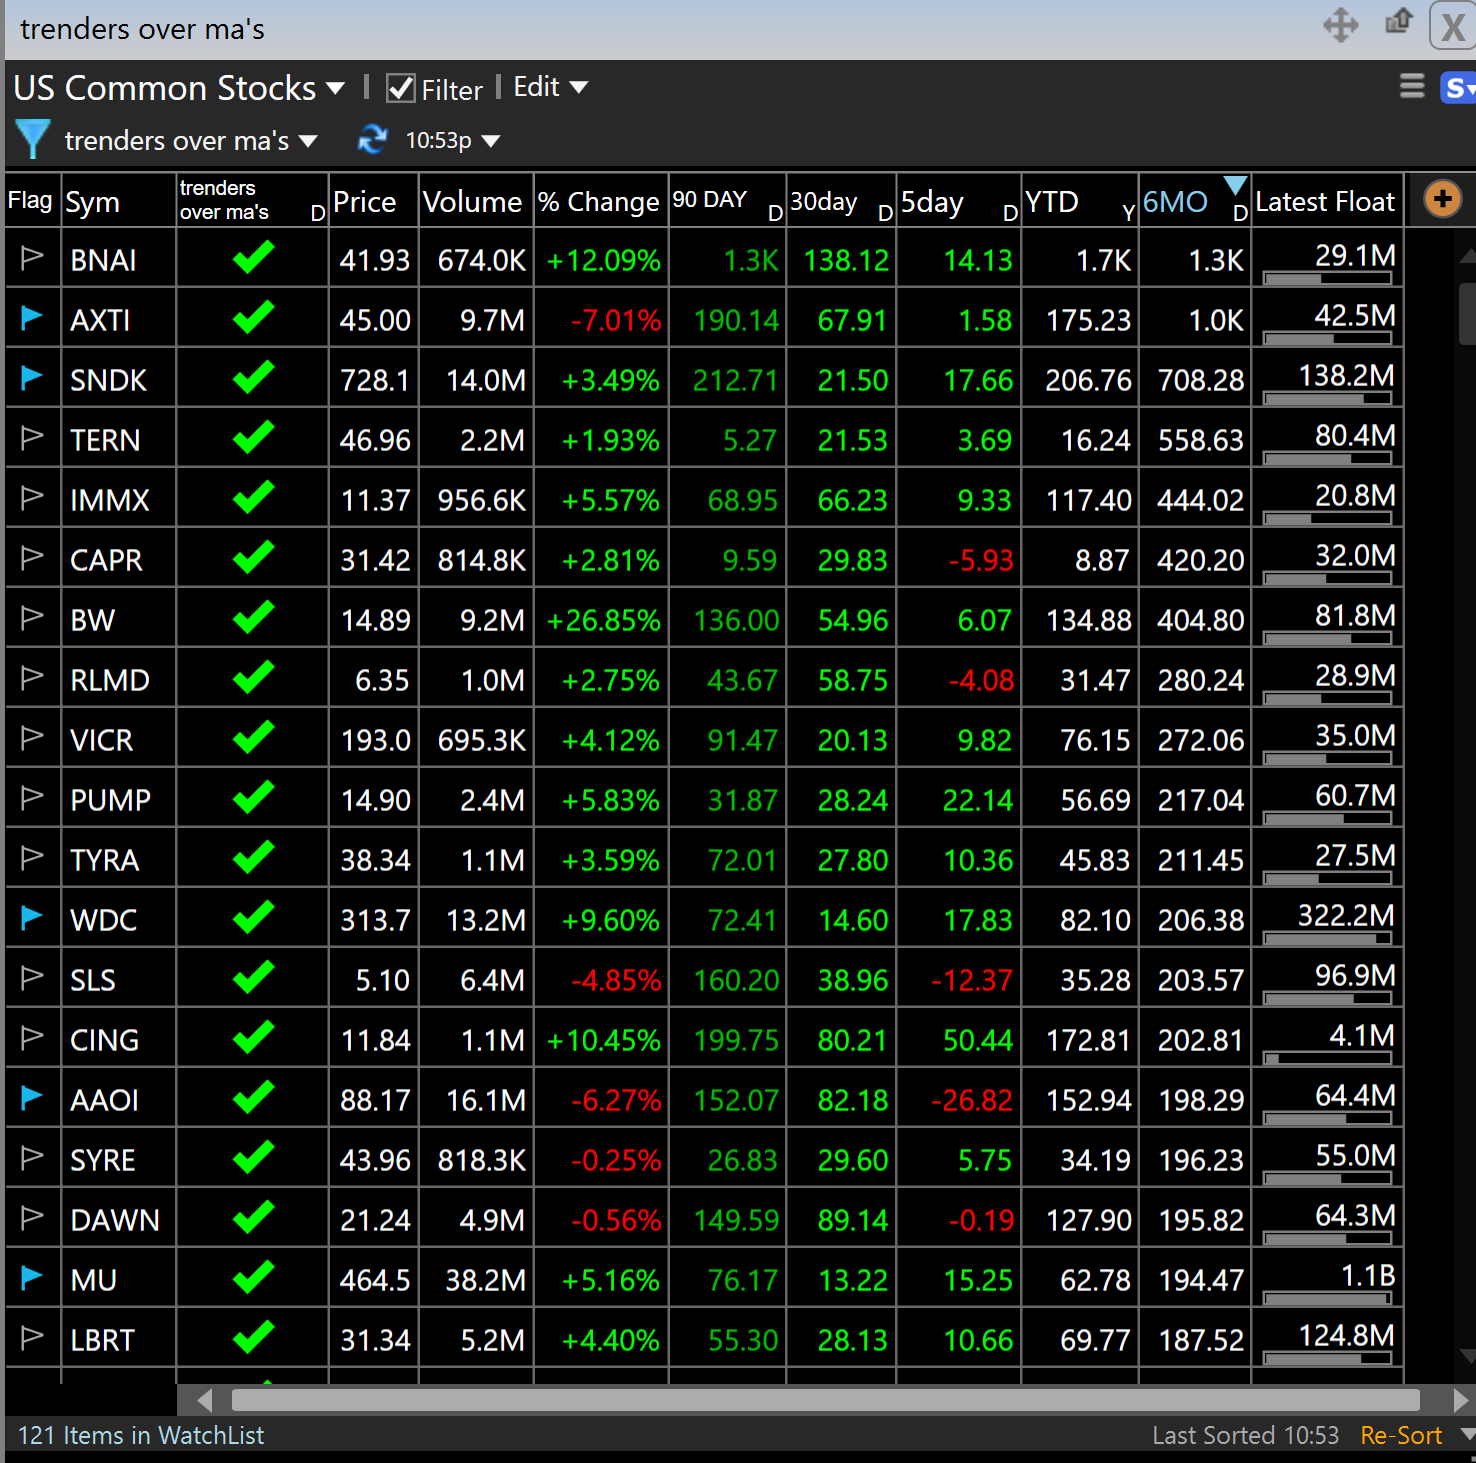
Step 3: The Trender Over Moving Averages Scan
Beyond the index approach, I run a dedicated scan every night for stocks in confirmed uptrends — above their 9, 20, and 50 EMAs. Then I flip through looking for my three setups.
Above all major moving averages means institutional sponsorship. Those are the stocks worth swing trading. Not trying to catch falling knives. Trending stocks taking a breath. That is the list. Feel free to use the Trenders Over Ma's Scan its yours!
Step 4: The Sunday Earnings Breakout Scan
Every Sunday I run a scan looking for recent earnings breakouts. Catalyst plays are my bread and butter for swing trades.
When a stock gaps up on earnings and breaks out of a base or resistance level, institutions do not just buy it on gap day and walk away. They buy over weeks and months. That creates sustained trends where every pullback is a buying opportunity, not a warning sign. I look for strong earnings reactions and then watch for the post-gap pullback to key moving averages. Secondary moves on earnings breakouts are often bigger than the initial gap.
Options vs Stock: When I Use Each
Stock is the default. Options are the exception.
Options are seductive because of the leverage. But when a stock is already running, implied volatility is elevated. You are paying a premium for that leverage and the market knows it. IV crush can kill you even when you are right on direction.
My rule: options only when IV is low, which usually means the stock is sitting in a quiet consolidation. The stock is calm. The options are cheap. IV has compressed because nothing is happening. Then the breakout comes — stock moves AND IV expands. Double tailwind on the option price. The CBOE Volatility Index methodology breaks down how implied volatility is calculated, which helps you identify when IV is genuinely compressed versus when it just looks calm.
$NOW qualified. Stock in a base, IV was low, options were inexpensive relative to the potential move. That is what put me in calls instead of stock.
For more on using options with smaller accounts, check out this post on options and small account growth.
Stop Loss Placement for Swing Trades
Simple rule: the stop is based on the equity chart, not the option price.
On $NOW, my stop was under the 50 SMA and under the base level. Why those? Because if $NOW broke back below its base and below the 50 SMA, my thesis was wrong. Wrong about the permanent bottom. Wrong about institutional accumulation. Time to exit and reassess.
Never set a stop based on how much the option has dropped. If calls go from $4.20 to $3.00, that drawdown alone does not tell you anything useful about whether the trade still makes sense. The stock chart does. Find the level that invalidates your thesis, place the stop under it, then calculate position size from that stop distance.
Same logic applies whether you are trading the stock or the option. The risk management framework is identical either way.
Scaling Out of Swing Trades
Getting in is the easy part. Holding through noise is where most traders fail. Having a scale-out plan before you enter removes the emotion from exit decisions.
My framework:
First trim — when the position covers initial risk. On $NOW that was when the calls doubled from $4.20 to $7.00. Selling half there removed all financial stress from the remaining position. Nothing to lose on the rest.
Second trim — into the next resistance level or extended momentum. $NOW pushed to $13.00 near the close. Extended. Trim another quarter.
Final position — rides with a stop based on the equity chart. If the stock breaks key support, sell. If it keeps stair-stepping, let it run.
Scaling out systematically removes risk while keeping exposure to the continued move. For more context on how this fits into a broader day trading versus swing trading approach, the core principle is identical across both.
The Double Dip Mindset
Most traders fail at swing trading because they run out of patience, not because they picked bad stocks.
Swing trading requires holding through noise. The stock goes against you for a day. Sits flat for a week. Tests your level and looks like it is breaking down, then reverses. Without a thesis — a real reason you bought, not just because it looked good — you bail at the worst moment every time.
My philosophy is what I call The Double Dip. When I was learning to trade, I kept my day job while building my trading account simultaneously. Two income streams, zero pressure to force trades. That patience mentality carries into every swing trade. No desperation for the stock to move today. I have a thesis, a stop, and I let the market work.
For anyone learning the craft of trading from scratch, this patience mindset separates the traders who make it from the ones who blow up chasing quick profits.
Pre-Trade Checklist
Five questions before every swing trade. Miss one, pass on the trade.
Named pattern? Bone Zone pullback, 9 EMA pullback, or base breakout pullback. No name, no trade. The SEC investor education resource on technical analysis covers why disciplined chart-based rules matter for retail traders.
Liquid enough? Minimum one million shares per day average volume. Thin stocks get stuck when you need to exit.
Orderly pullback? Red candles on the pullback should be smaller than the green candles on the prior move up. Heavy distribution during a pullback is a warning sign. Light, declining volume means sellers are exhausted.
Bone zone green? Green zone equals uptrend. Red zone equals wait for the 50 SMA. Do not fight that signal.
Juice worth the squeeze? Look at the prior thrust. If the stock moved $5 last leg and my risk is $0.50, that is a potential 10:1 setup. Worth it. Prior move was $1, risk is $0.50? Skip it.
More on identifying explosive stocks and building your scan process at this post on how to scan for explosive stocks.
Common Mistakes on Pullback Trades
Buying chaotic pullbacks for swing trades. Stock drops 15 percent in two days? Day trade it on a five-minute chart if you want, but do not swing it overnight. Crashes have no technical structure. Probability cannot be assigned to chaos.
Stops too tight. Normal daily volatility shakes you out when your stop is within the noise range. The stop needs to sit below the level that invalidates the thesis, not just a few cents below entry.
Holding through distribution. When the red candles on a pullback start getting bigger than the green candles, institutions are selling. Setup is broken. Get out and find a cleaner chart.
Ignoring the sector. A semiconductor pullback setup with the semiconductor index in a downtrend has a headwind working against it. Best swing trades come from stocks in leading sectors. Always check the index before trading the component.
Study your candlestick chart patterns until each candle type is automatic. Knowing what volume and candle structure is telling you separates good entries from random ones.
FAQ: Swing Trading Pullback Strategy
The 9 EMA is my primary level. Fast enough to catch the early recharge, not so fast that every wiggle counts. For deeper pullbacks in extended trends, the Bone Zone or 50 SMA depending on how long the trend has been running.
Most swing trades resolve in one to two weeks. The stair-step momentum thrusts I play for typically last three to seven trading days. Long-term base breakouts like $NOW are exceptions where I hold as long as the thesis holds.
Volume is the tell. Orderly: declining volume on down days, smaller red candles than the prior green candles. Breakdown: expanding volume on down days, large red candles gapping below key moving averages. When in doubt, stay out.
Stock is the default. Options only when implied volatility is low, which usually happens during a quiet consolidation before the move. High-momentum plays have elevated IV that makes options expensive even when you are right on direction.
The area between the 9 EMA and 20 EMA on the daily chart. When a stock in a green uptrend pulls back into this zone on light volume and then prints a green candle closing back above the 9 EMA, that is the signal. One of the highest-probability swing entries I know.
Base it on the equity chart. Find the level that proves your thesis wrong. For most pullback trades, that is just below the moving average the stock is holding or below the base it broke out from. If it closes below that level, the setup is invalidated and you exit.
After a base breakout, the first higher low is when the stock pulls back but holds above the old resistance, now acting as support. Confirms the breakout was real. Gives you a tight, defined risk level. One of the best entries in swing trading. Same theory applies to Flat Top Breakouts or Earnings Breakouts.
Three to five. Enough to diversify single-stock risk, not so many you cannot track each thesis. Every position needs a clear entry reason, defined stop, and profit target framework before it goes on.
Yes. Trade fewer shares, but percentage returns can be identical to a larger account when you manage risk at one to two percent per trade. Focus on setups in lower-priced stocks where position sizing does not create slippage.
Starting with sector ETFs filters you toward stocks with institutional tailwinds. A pullback in a leading sector has far better odds of resuming its uptrend than a pullback in a sector that is lagging or breaking down.
Weak sector, expanding volume on down days, chaotic rather than orderly pullback, prior move that does not justify the risk, or an earnings announcement during your intended hold period without a plan to manage it. Any one of those is enough reason to pass.
The prior thrust is your roadmap. Stock moved $5 on the last leg before pulling back — look for a similar $5 on the next leg. Sets your profit target and tells you whether the risk-reward makes sense before you enter.
Ready to Trade Pullbacks With a System?
Knowing the rules is step one. Executing them under live market conditions — when the stock is going against you and every instinct says to bail — that is the real game. We have a full Swing Trading Chatroom also with a trial. Come check it out!
In the 60-Day Live Trading Bootcamp, I teach this system step by step with real markets, real trades, and immediate feedback. You watch me take these exact setups in real time, from entry through the full scale-out. Over 7,000 students have gone through the program. Most came in unsure of when and how to buy pullbacks. They left with a repeatable process and the discipline to execute it.
Watch me trade live at youtube.com/@kunaldesaitrading. Real setups, real entries, real exits.
Your edge is a proven process executed with discipline every single day.
About the Author
Kunal Desai is the founder and CEO of Bulls on Wall Street, a trading education company founded in 2008. Trading professionally since 2007, he has trained over 7,000 students through the 60-Day Live Trading Bootcamp. His work has been featured in Forbes, Fortune, and Inc. He trades momentum stocks daily using TC2000 for scanning and charting.