

Updated May 2026.
I have been trading since 1999 and have taught over 7,000 students how to trade, and candlestick patterns are the very first thing I cover in the 60-Day Bootcamp. Not because they are some magic signal. Because they are the alphabet of price action. Every setup I trade, whether it is an opening range break, a bull flag, or a parabolic short, starts with reading the candles in context. After 25-plus years of staring at charts every single day, here is exactly how I use candlestick patterns, and just as important, how I do not.
Grab the free cheat sheet PDF below, but read this first. The PDF is the map. This article is how to actually drive.
A Quick Word on Where Candlesticks Came From
Candlestick charts were developed by Munehisa Homma, a Japanese rice trader in the 1700s. Homma figured out that price reflected the emotions and behavior of the crowd, not just supply and demand. Fear, greed, hope, panic. That is still all a candle is. A picture of who won the fight between buyers and sellers over a set period of time. Nothing has changed in 300 years except the speed.
How I Actually Use Candlestick Patterns After 25 Years
This is the part nobody tells you, and it is the reason most beginners blow up trading candles. Two rules run everything I do.
Rule 1: Read patterns on the big picture, not minute by minute.
We are day traders. We trade price action and price patterns. But reading candlesticks on a one-minute basis is too much noise. Even five-minute by five-minute is too much noise. The way you actually want to look at candlesticks is for very specific patterns on a very big picture, and that is it. Everything else is static.
I read named candlestick patterns on the daily chart. That is where they carry weight. On the intraday five-minute chart I am not hunting for hammers and shooting stars. I am reading structure. Is price pulling back into the Bone Zone between the 9 EMA and 20 EMA on lighter volume, and is it printing a green candle to trigger. That green candle is a confirmation inside a defined setup, not a pattern I scanned for. Big patterns live on the daily. Intraday is structure and execution.
Rule 2: A candle is idea generation, not an action signal.
When you see a price pattern, it does not mean you act on it. It means the stock goes on your list. It is for idea generation. The same goes for candlesticks. Just because you see a certain candle does not mean anything on its own. It only matters inside the context of price patterns and price action.
A shooting star in the middle of a sideways chop range is nothing. The exact same shooting star on a stock that is parabolic, overbought, and stretched outside the upper Bollinger Band is a loaded gun. Same candle. Completely different trade. The candle does not make the decision. The context does.
Hold those two rules in your head for the rest of this guide. Every pattern below is taught through that lens.
How to Read a Single Candlestick
Before patterns, you have to read one candle. Every candle gives you four prices over its timeframe.
- Open: the first traded price
- High: the highest price reached
- Low: the lowest price reached
- Close: the final traded price
The body is the thick part between the open and the close. Green body means it closed higher than it opened, buyers won. Red body means it closed lower than it opened, sellers won. The wicks, also called shadows, are the thin lines sticking out of the body. They mark how far price pushed before getting rejected back.
If you are brand new to charting, Investopedia has a clean primer on the basics.
How to Read the Wicks
Most beginners stare at the body and ignore the wicks. The wicks are where the story is. A wick is rejection. It is price trying to go somewhere and getting slapped back.
A long lower wick means buyers stepped in down low and shoved price back up. Sellers tried to push it down, failed. A long upper wick means sellers showed up at the highs and rejected the buyers. Price tried to break out, got sold.
That is the whole reason a hanging man at the top of a parabolic run matters. The long lower wick looks bullish, like the stock got bought up. But it still closed red, and there is no upper wick, which tells you the buying pressure is fading even though it bounced off the lows. Read the wicks and you read who is actually in control.
The Candlestick Patterns That Actually Matter
You do not need to memorize 50 patterns. You need to know these cold, and you need to know what each one means about who is winning the fight. I have grouped them the way they actually form: single candle, two candle, three candle, and continuation.
Single-Candle Patterns
Doji. Open and close finish at nearly the same price, leaving a tiny body with wicks on both sides. It means indecision. Nobody won. By itself a doji is noise. I do not trade it. What it does is flag that a trend might be running out of gas, so a doji after an extended move at a key level goes on the watchlist as a heads-up, never as a trade on its own.
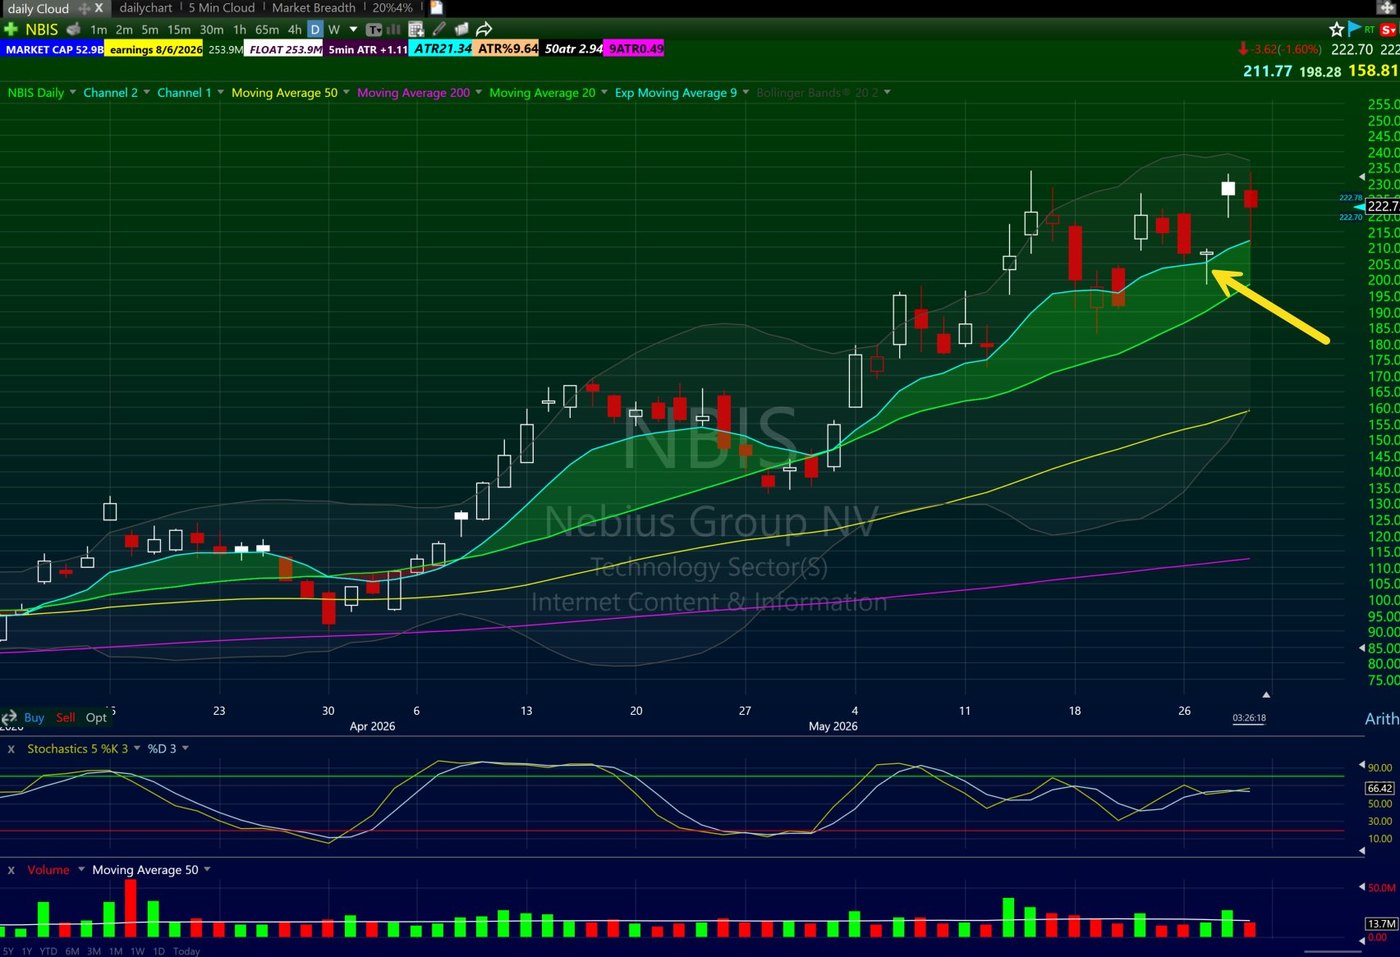
Hammer. Small body up top, long lower wick, little to no upper wick. Bullish reversal. I like this one when a stock knifes through a support level, flushes the weak hands, then closes back above it. That long lower wick is the flush getting bought. Real example, $NBIS, a stock we trade. The stock was riding higher, then put in a two-day pullback and a dumpster dive intraday down into the $200 level. Buyers reversed it hard off that $200 support, which also lined up with the Bone Zone between the 9 EMA and 20 EMA. It closed the day back near $210, a confirmed end-of-day reversal, leaving a clean hammer printing right out of the bone zone. That is a bullish signal into the next day. Notice this is not just a hammer. It is a hammer at a round-number support that is also the bone zone on the first pullback of a strong trend. Three pieces of context stacked on one candle.
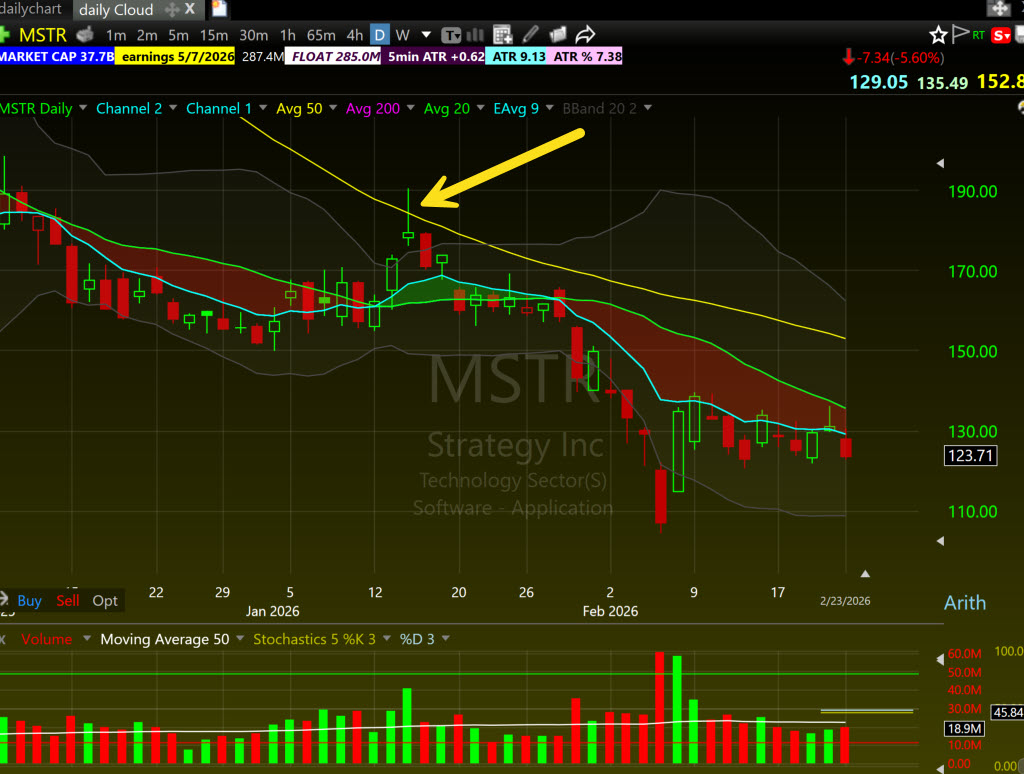
Inverted Hammer. Small body, long upper wick, after a downtrend. Potential bullish reversal. In one of my $MSTR swings you could see the inverted hammer print right at $190 into the 50 SMA. The next day gave a deep red candle and the downtrend continued. The lesson is the same as always. The candle at a resistance level told me sellers were lurking. When you pair the right candle with a key level, you supercharge the read.
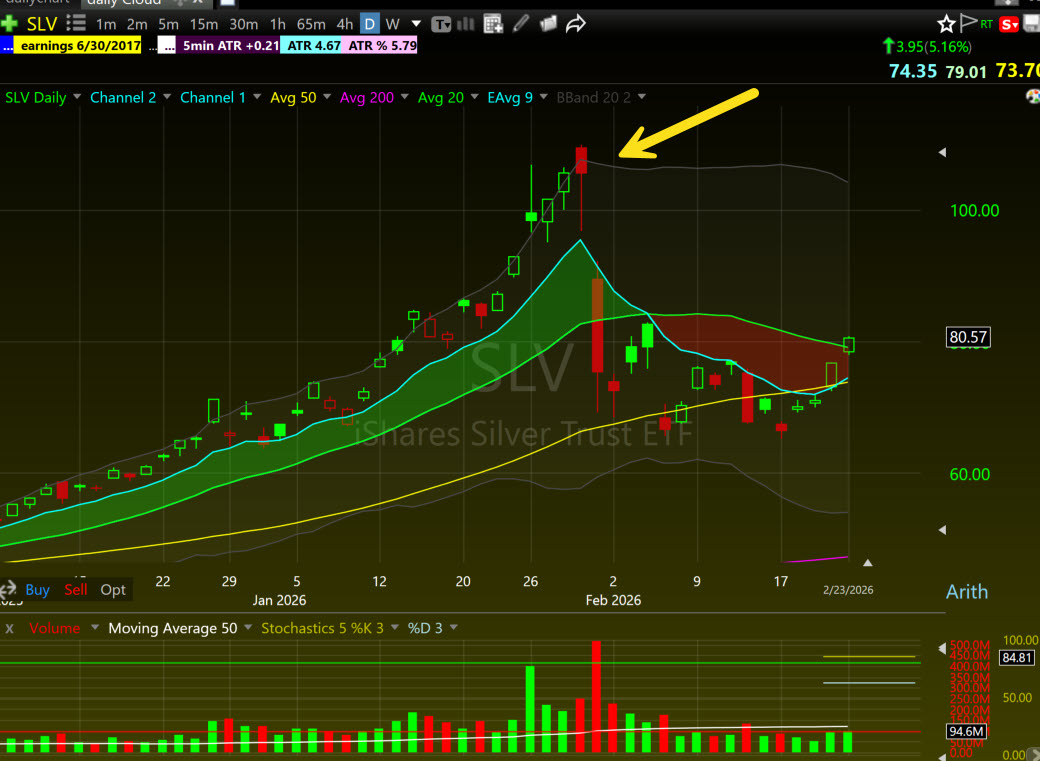
Hanging Man. Looks identical to a hammer, but it shows up at the top of an uptrend, which flips its meaning to bearish. Real example, $SLV. The stock goes parabolic, flushes during the day, then gets bought back up to close near the highs, leaving that long lower wick. Traders see the bounce and think bullish. But it closed red, there is no upper wick, and the buying is starting to wane. What followed was a full breakdown.
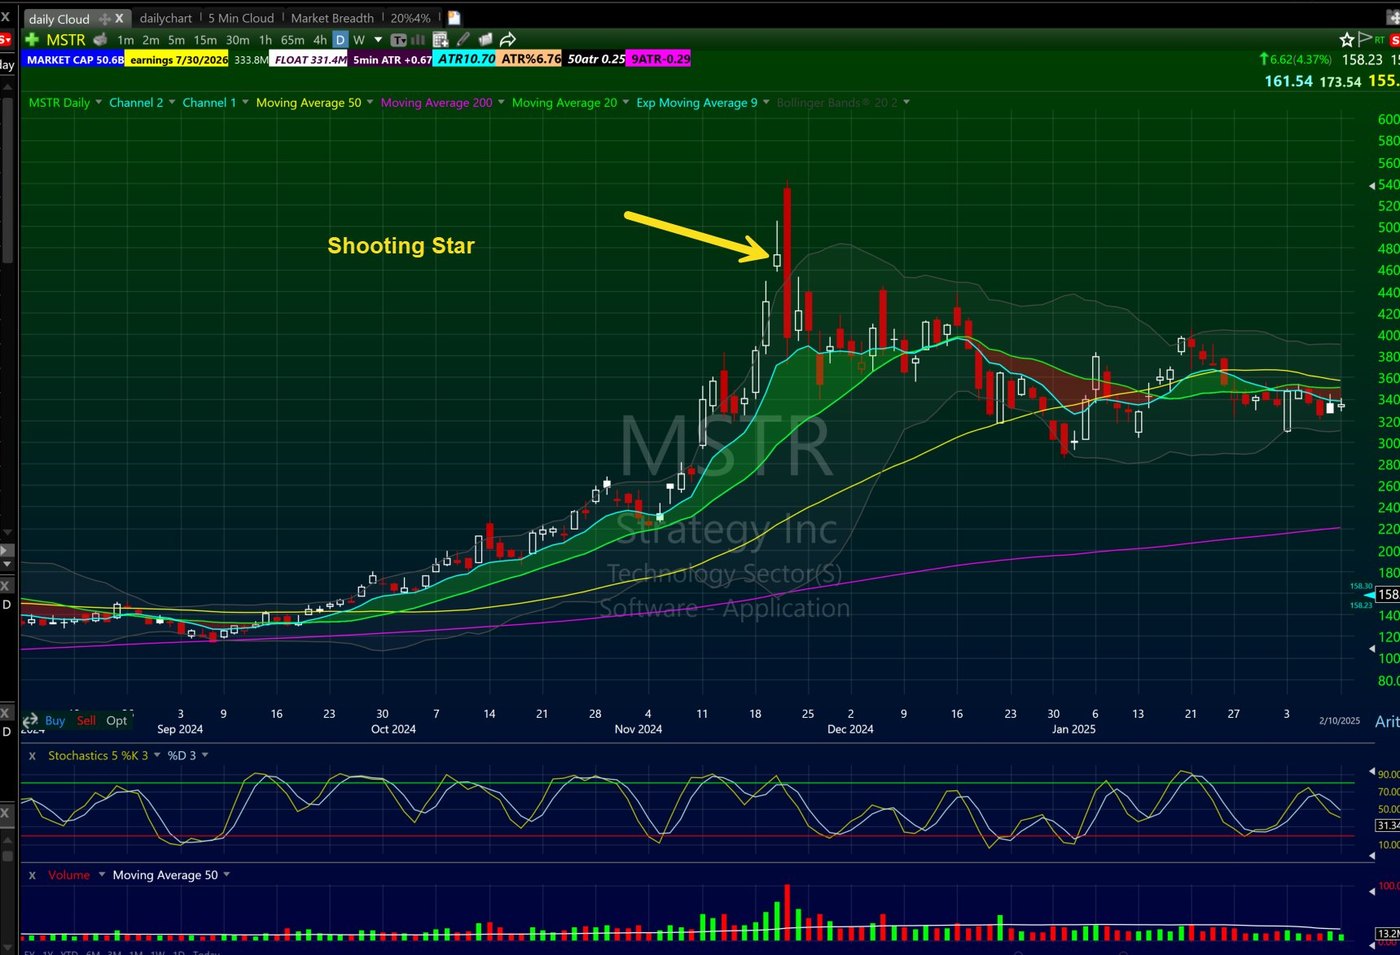
Shooting Star. Small body down low, long upper wick, after an uptrend. Sellers showed up at the highs and rejected the move. This is one of my favorites because it feeds the parabolic short. Look at $MSTR in November 2024. It was already on my watchlist because it was parabolic, overbought, and stretched outside the upper Bollinger Band. Then the icing on the cake was the shooting star, which told me heavy sell pressure hit that day and sellers were finally showing up. So the next day when the stock gapped up, it set up a clean green-to-red move and I took the short for a day trade. The candle did not make the trade. The parabolic context made the trade, and the candle confirmed the timing. We broke that whole setup down in our guide to trading parabolic stocks.
Marubozu. A big candle with no wicks, or almost none. It opened at one extreme and closed at the other. A green marubozu means buyers were in total control all session, a red one means sellers ran the table start to finish. It signals conviction and usually continuation. When I see a wide-range marubozu break a key level on volume, I take the breakout seriously.
Spinning Top. Small body, wicks on both sides, like a doji with a little more body. Same message as a doji. Indecision. Heads-up, not a trade.
Two-Candle Patterns
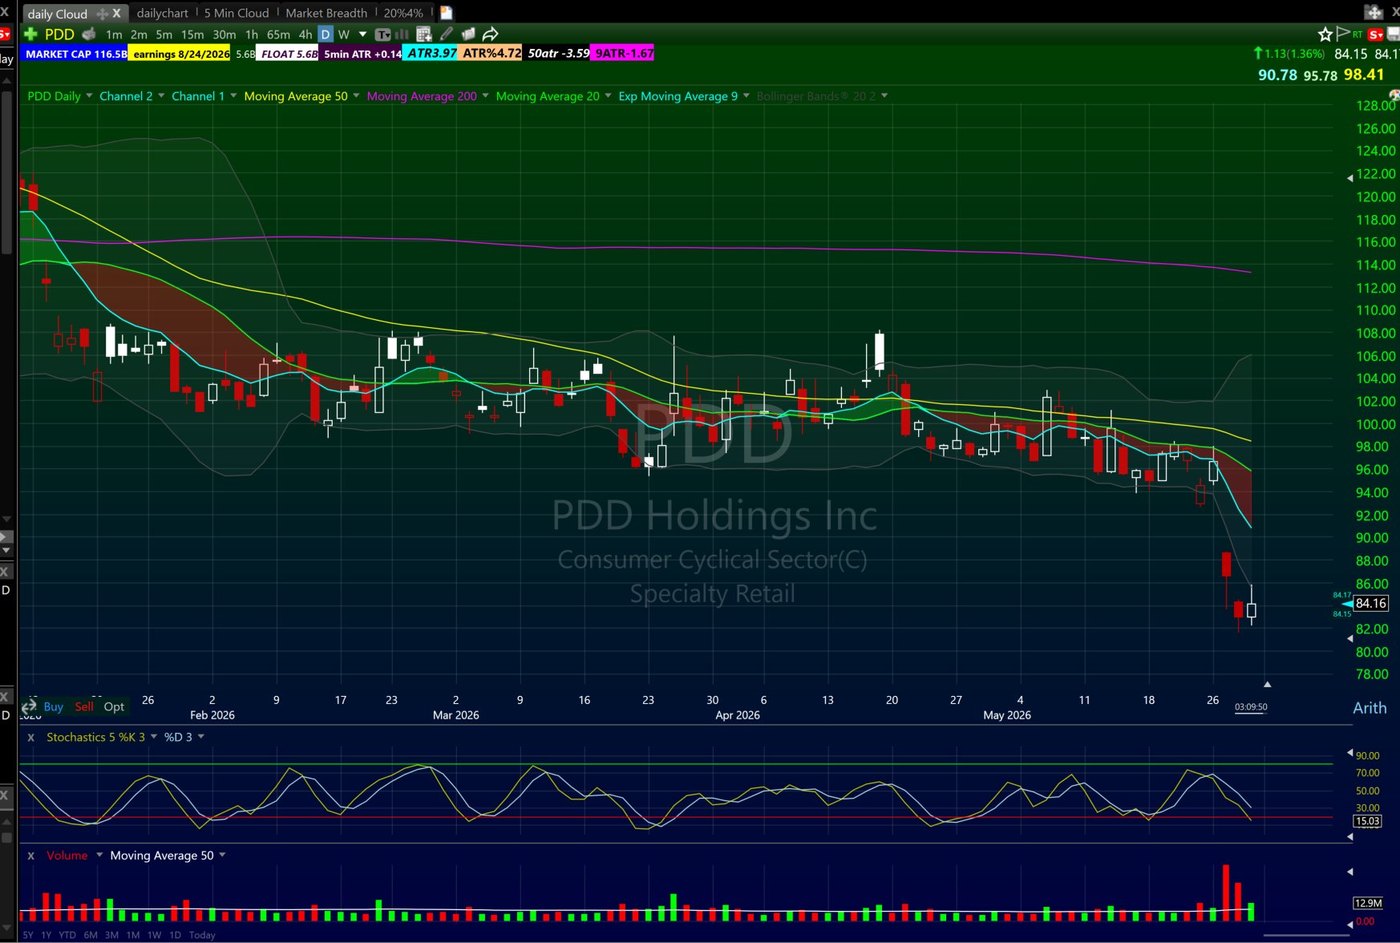
Bullish Engulfing. A big green candle completely engulfs the prior red candle. Buyers overwhelmed sellers. Real example, $PDD. The stock was in a long grinding downtrend, then it flushed hard on the heaviest volume bar on the whole chart, a capitulation move, and buyers stepped right back in to engulf the prior candle down at the lows. That is the version of an engulfing I care about. Not a pretty candle in the middle of nowhere. An engulfing at the bottom of an extended downtrend on capitulation volume, where the context says the sellers may finally be exhausted.
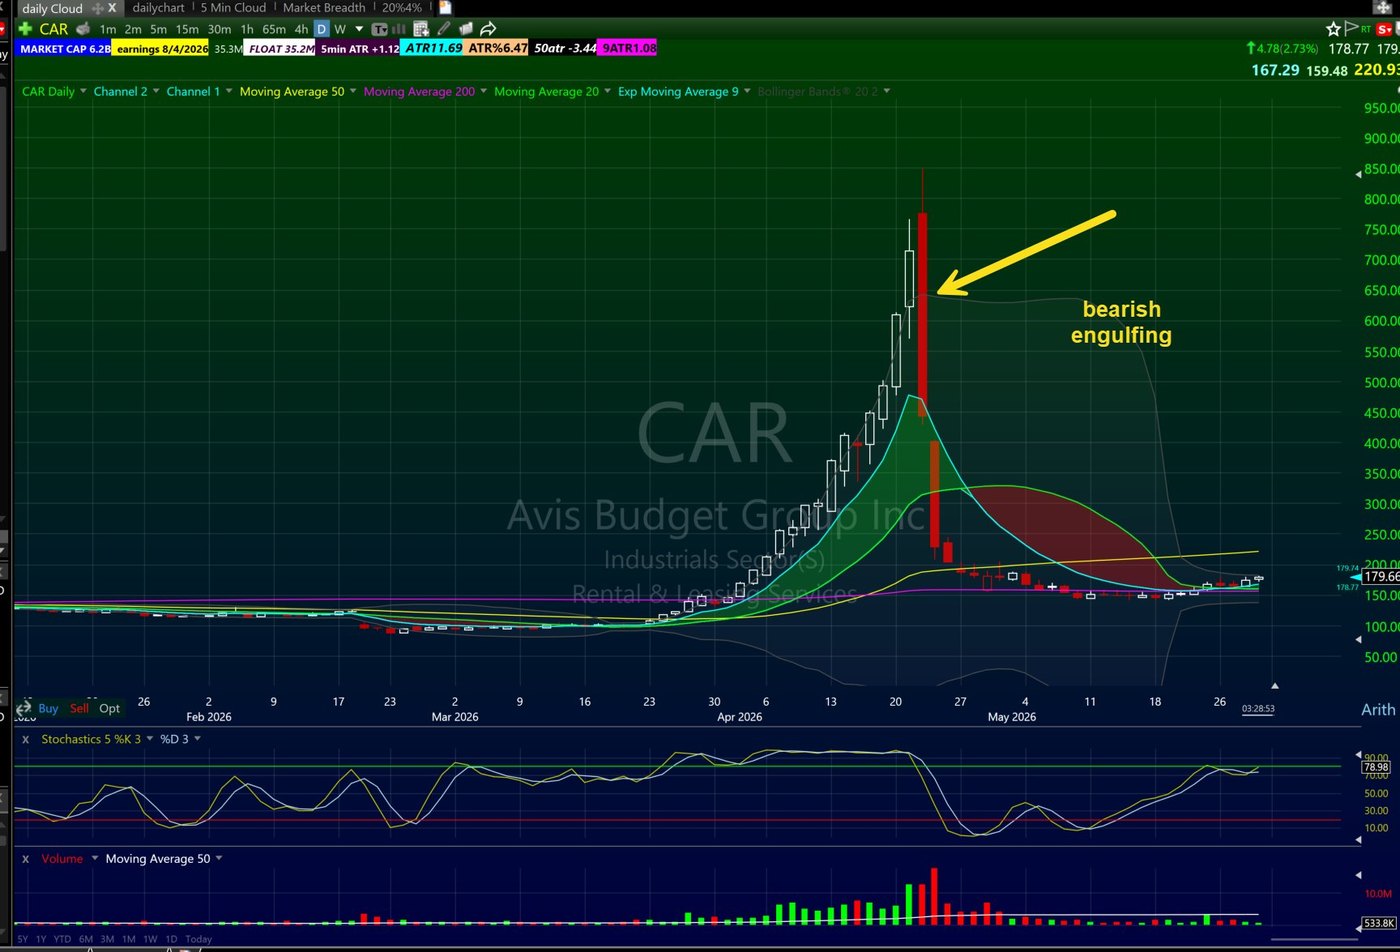
Bearish Engulfing. The mirror image. A big red candle swallows the prior green candle after an uptrend. Sellers took the wheel. Real example, $CAR. The stock had a monster short squeeze from $100 to $850, then printed a huge bearish engulfing candle that dropped it from 800 to 450 in a single day on the heaviest volume on the chart. Here is the part most traders get wrong. After a drop that big you would think there is no more downside left. Wrong. When you get an engulfing candle that violent off a parabolic top, the next day is almost always a washout. CAR opened the next day around 400 and just ticked straight down the whole session all the way to 200. The engulfing candle was the idea. The next-day continuation was the trade. Same lesson as the shooting star. The candle puts it on your radar, the follow-through is where you make the money.
Piercing Line. A long red candle followed by a green candle that closes back above the midpoint of that red candle. Two-candle bullish reversal that says buyers are stepping in after a drop. I want it near a key support level with volume coming in on that second candle. Without volume it is just noise.
Dark Cloud Cover. The bearish version of the piercing line. A green candle, then a red candle that opens higher but closes back below the midpoint of the green one. Buyers got trapped. Best read at the top of an extended move into resistance.
Tweezer Tops and Bottoms. Two candles that put in nearly the exact same high (tweezer top, bearish) or the exact same low (tweezer bottom, bullish). It shows price tested a level twice and got rejected both times. I treat these as level confirmation, a sign that support or resistance is real.
Harami. A small candle that sits entirely inside the body of the previous larger candle. It signals the prior momentum is stalling. By itself it is a heads-up, not a trigger, but a harami after a big trending candle at a key level tells you the move is losing steam.
Three-Candle Patterns
Morning Star. Three candles at a bottom. A big red candle, then a small indecision candle that gaps down, then a big green candle that drives back up. It marks a shift from sellers to buyers. Like everything else, it carries the most weight after an extended downtrend at a level, not in the middle of a range.
Evening Star. The bearish mirror. A big green candle, a small indecision candle, then a big red candle that confirms sellers have taken over. I see this most after earnings gaps and parabolic runs when a stock is extended well above its moving averages. The context is everything. An evening star after a stock is up 50 percent in a week means a lot more than one in a choppy range. These show up constantly during earnings season when stocks gap up and fail.
Three White Soldiers. Three strong green candles in a row, each closing near its high, stair-stepping up after a downtrend. Powerful bullish reversal showing buyers seized control and held it for three straight sessions. The cleaner and more orderly the three candles, the better the signal.
Three Black Crows. Three strong red candles in a row after a steep uptrend, showing momentum shifting from buyers to sellers. I look for this in the context of a rubberband or blow-off-top setup, when a stock has gone parabolic and the three crows confirm the air is coming out.
Continuation Patterns
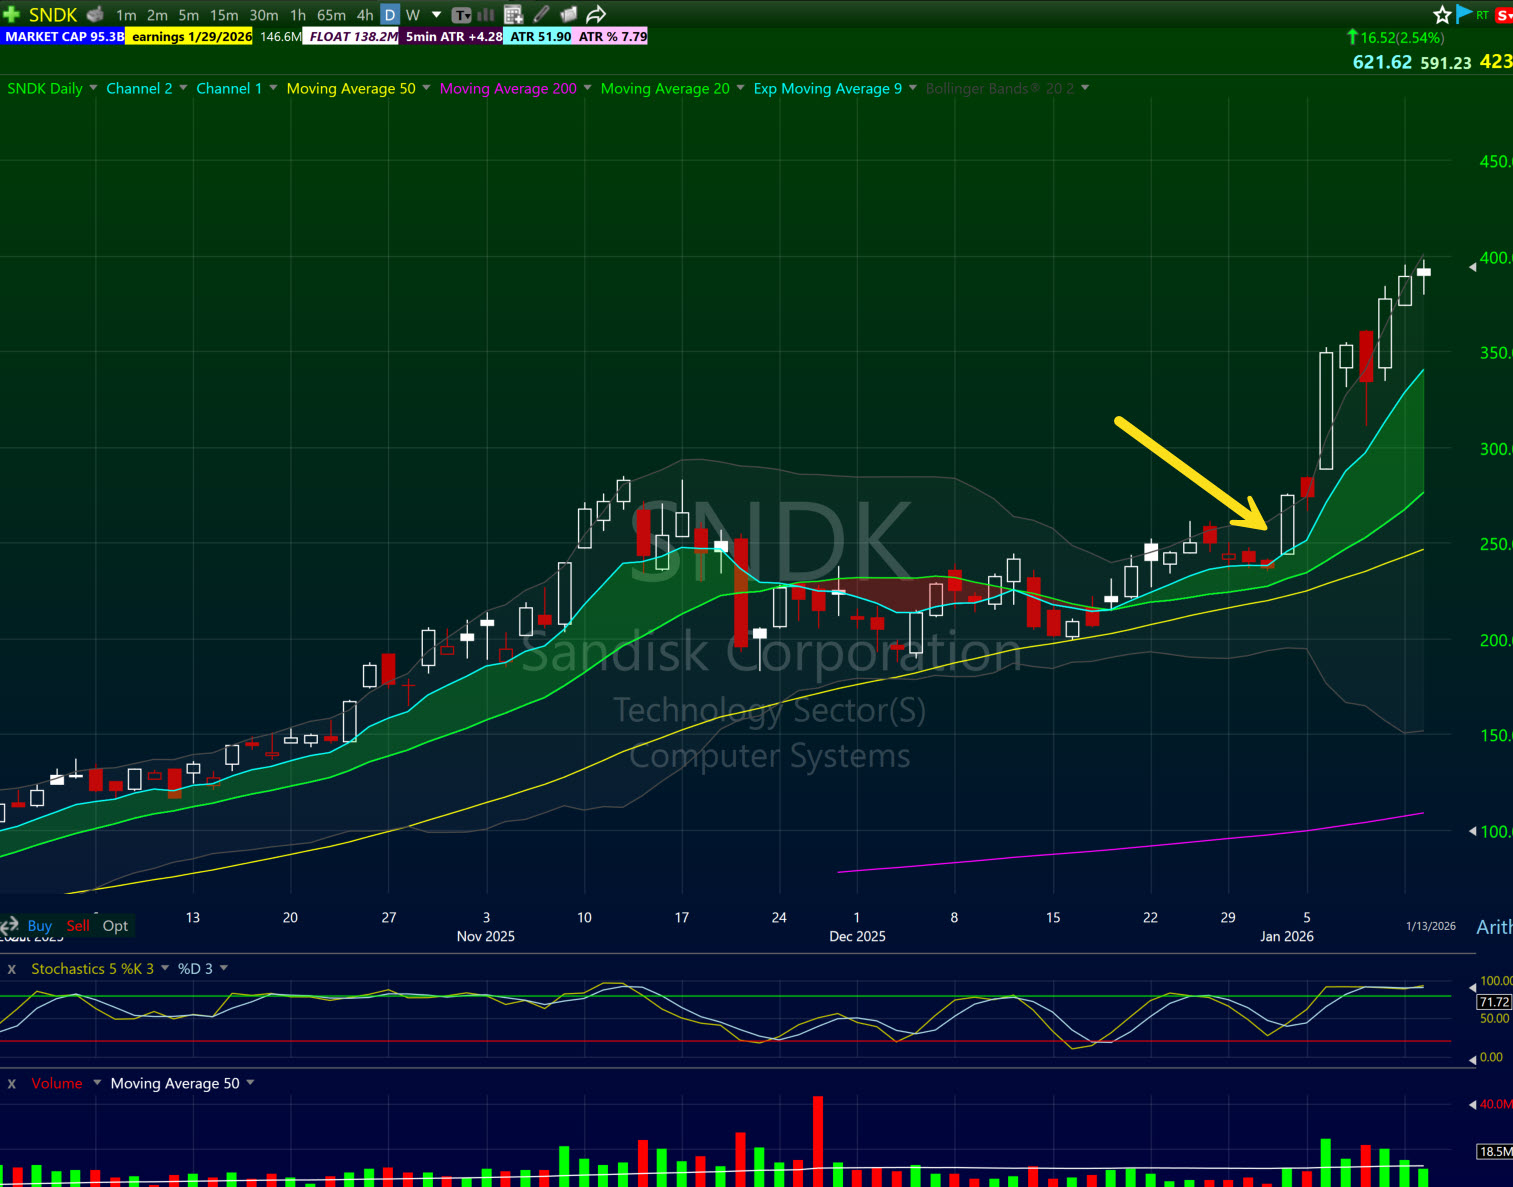
Rising Three Methods. A five-candle bullish continuation that forms in an uptrend. A big green candle, three small pullback candles that stay inside its range, then another big green candle that resumes the trend. It is basically a quick, orderly pullback, and orderly pullbacks in strong trends are money makers. I love coupling it with the 9 EMA and 20 EMA zone, like this $SNDK pullback right into the 9 EMA. This is the daily-chart cousin of our first pullback trading strategy, one of the most reliable setups we teach in bootcamp.
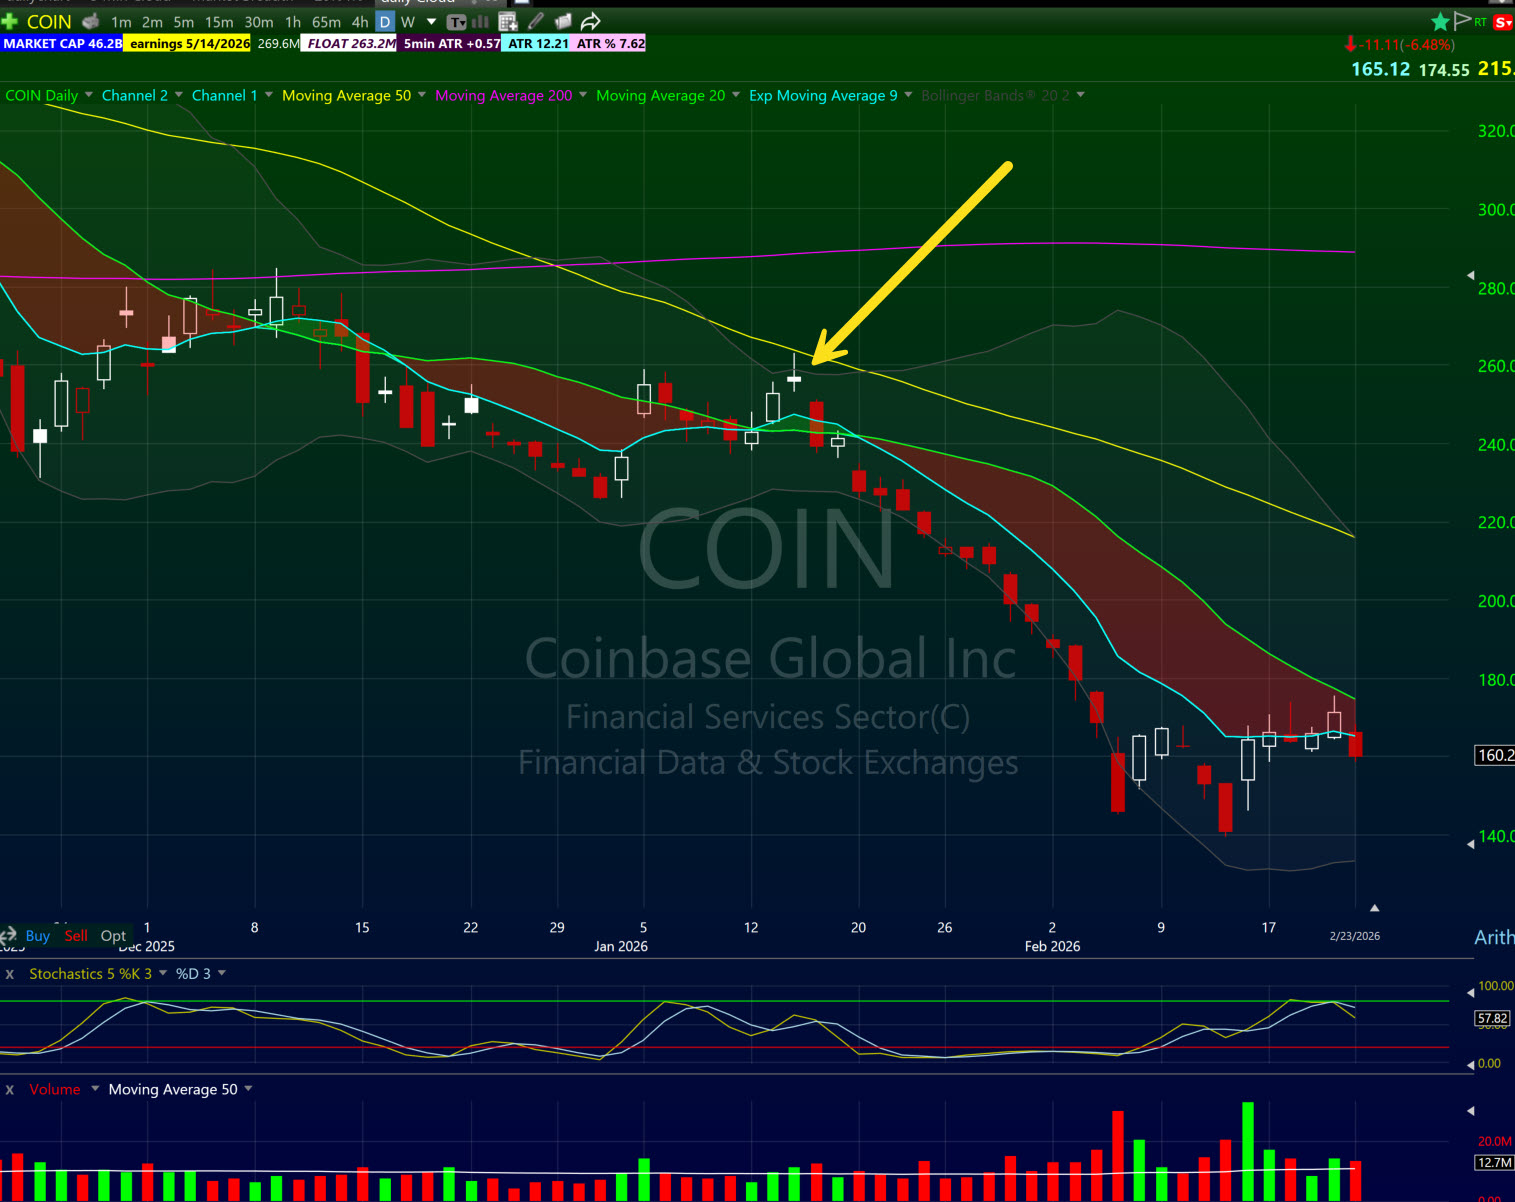
Falling Three Methods. The bearish version. A long red candle, three small green candles that pause inside the range, then another red candle that resumes the downtrend. Classic example, $COIN. After a downtrend you get a three-day bounce into the 50 SMA resistance. Those three up candles give the bulls false hope that the bottom is in, but all the stock is doing is working off oversold conditions before the selling resumes.
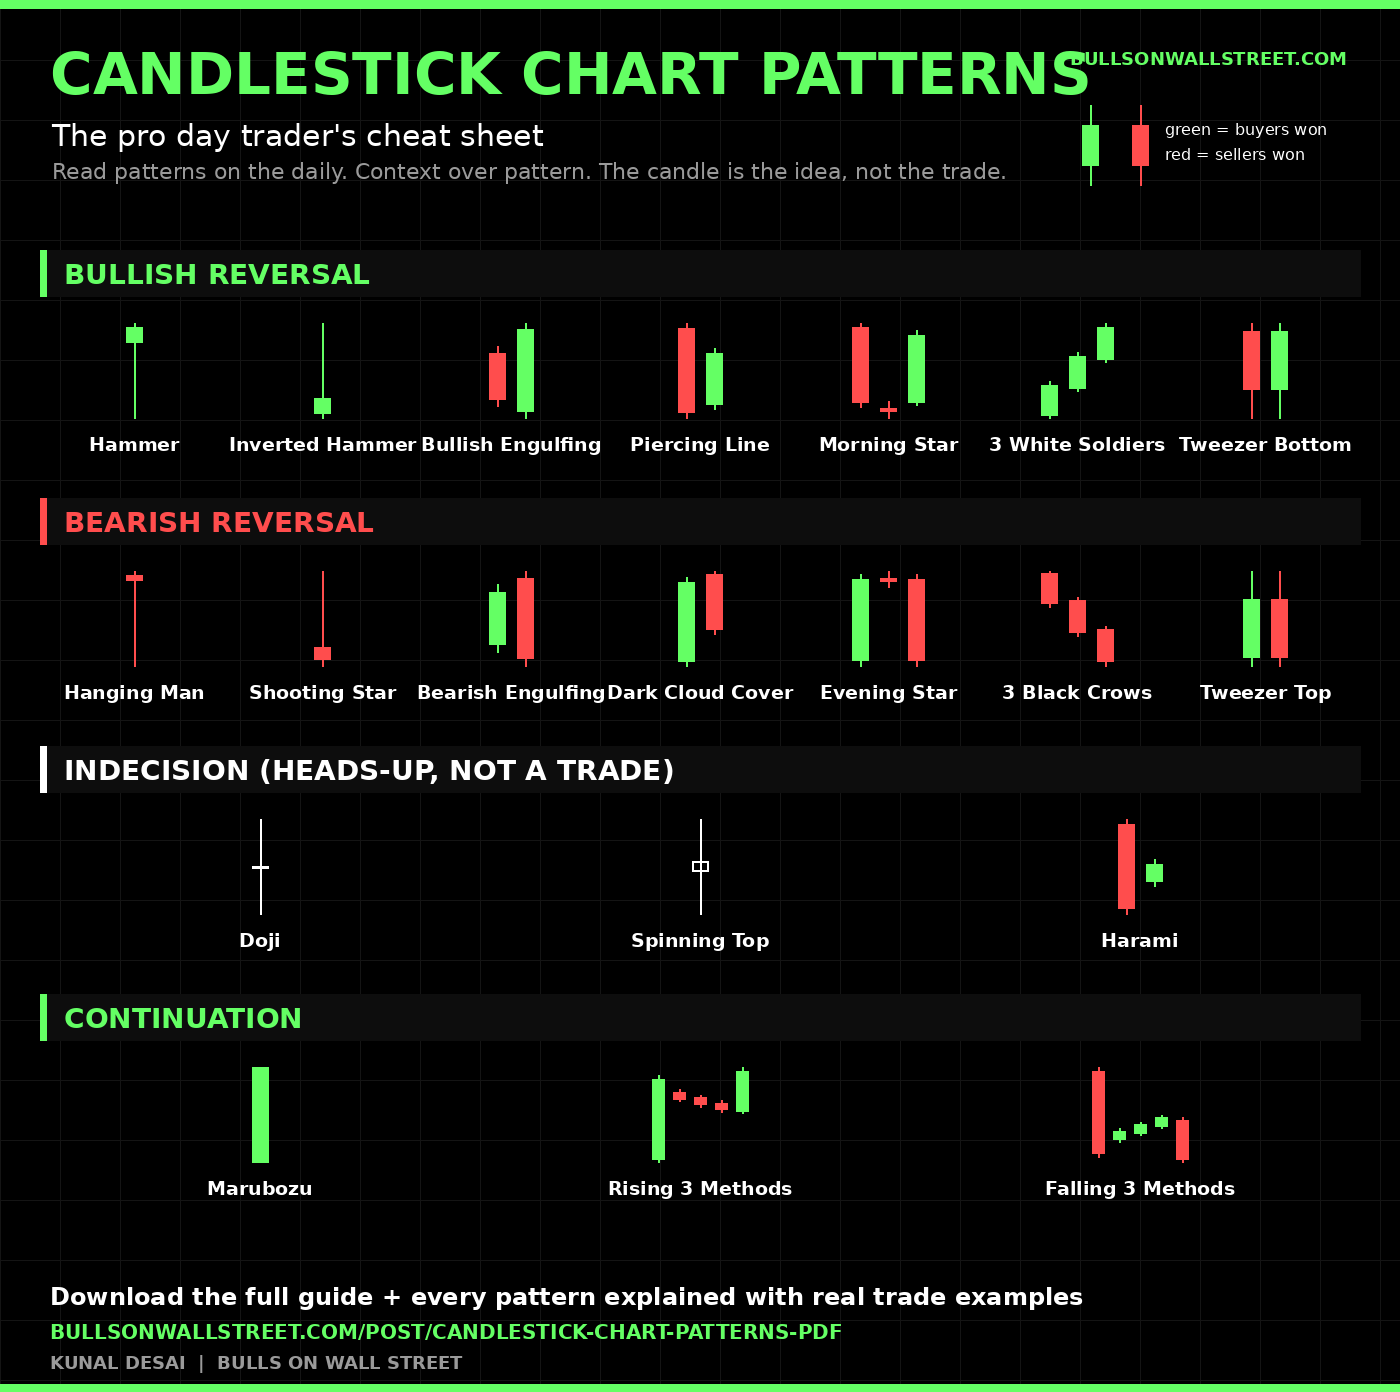
Candlestick Pattern Cheat Sheet
Here is the full set on one page. Bullish, bearish, indecision, and continuation. Save it, print it, keep it next to your monitor while you build the muscle memory.
How to Make Candlestick Patterns Actually Work
Here is the brutally honest part most candlestick guides will never tell you. On their own, candlestick patterns do not work.
The most robust academic study on this, Marshall, Young and Rose in the Journal of Banking and Finance, tested candlestick signals across Dow Jones stocks and found they produced no statistically significant edge by themselves. No magic. And that lines up exactly with what I have seen across 7,000 students. The pattern is maybe 20 percent of the equation. The other 80 percent is context.
So how do you get the 80 percent. You stack the candle on top of real evidence.
- Support and resistance. A pattern at a key level is a setup. A pattern in the middle of nowhere is noise.
- Trend and moving averages. Where is the stock. Extended and parabolic, or pulling back into the 9 and 20 EMA. The location changes the meaning.
- Volume. A reversal candle on heavy volume is real conviction. The same candle on dead volume is a fake-out. The $PDD engulfing mattered because of the capitulation volume under it.
- Confluence. The shooting star on $MSTR only became a trade because it stacked with parabolic, overbought, and a tag of the upper Bollinger Band. One of my favorite confluence tools intraday is VWAP. If you do not use it yet, read our breakdown on what VWAP is and how to use it as a day trader.
The candle tells you something might be happening. The context tells you whether to act.
Common Mistakes to Avoid
- Trading patterns in isolation. They see a hammer and buy. They see an evening star and short. Without looking at anything else. That is not trading, that is gambling with a fancy name.
- Ignoring the timeframe. Hunting named patterns on the one-minute is chasing ghosts. Read patterns on the daily, read structure intraday.
- Forgetting volume. No volume, no conviction, no trade.
- Overtrading. If you do not have clear rules for when to sit on your hands, that is a risk problem. Read our professional guide to risk management in day trading, and run every idea through a pre-trade entry checklist before you click buy.
Practice Like a Pro
You cannot read this article and trade candles tomorrow. You build the eye through reps.
- Pull up historical charts and find every pattern in this guide on the daily timeframe.
- Use a scanner to surface the right candidates each day. Here is how to scan for the most explosive stocks to day trade.
- Fold candle reading into your nightly prep so it becomes automatic. Here is how to build a stock trading routine.
- Journal your winners and your losers and study both.
Download the Free Candlestick Patterns PDF
Keep every pattern in this guide one click away while you trade. No email required, just grab it.
👉 Download the free candlestick chart patterns PDF here
Insights From My Trading Journey
I started learning to trade in 1999 in college during the dot-com boom. Candlestick patterns were one of the first things I studied. I was reading every Steve Nison book I could find, trying to memorize every single pattern. That was a mistake. It took me years to realize the pattern itself is only about 20 percent of the equation. The other 80 percent is context. Where is the stock in its trend. What is the volume doing. Is there a catalyst. Is the broader market helping or hurting.
I went full-time in 2007 and started Bulls on Wall Street in 2008. After teaching over 7,000 students through the 60-Day Bootcamp, the number one mistake I see beginners make is trading patterns in isolation. The traders who make it use candlesticks as one piece of a complete system, combined with moving averages, volume, support and resistance, and a real trading plan. That is what we build in bootcamp, and that is what I have been doing every single day for over 25 years.
Frequently Asked Questions
Are candlestick patterns reliable?
Not on their own. Academic studies show no edge from patterns in isolation. They become reliable when you confirm them with volume, trend, and key levels. The pattern is the trigger, the context is the trade.
What timeframe works best for candlestick patterns?
The daily chart. Named candlestick patterns carry the most weight on the big picture. Reading patterns on the one-minute or even the five-minute is too much noise. Intraday you should be reading structure and price action, like a pullback into the 9 and 20 EMA, not hunting for individual candle patterns.
Can beginners use candlestick patterns effectively?
Yes, if you start small. Learn three or four patterns, master them on the daily chart, and always read them in context. Do not try to memorize all 50 at once.
How many candlestick patterns should I learn?
Start with the hammer, the engulfing candle, and the evening star. Master those before anything else. Most traders who try to memorize every pattern end up frozen at the screen.
What are the most profitable candlestick patterns?
In my experience, the hammer at key support and the shooting star or evening star after a parabolic move are the most reliable. But no pattern is profitable on its own. The context around it is what generates the profit.
What is the difference between a hammer and a hanging man?
They look identical. The difference is location. A hammer prints at the bottom of a downtrend and is bullish. A hanging man prints at the top of an uptrend and is bearish. Location flips the meaning.
How do I read candlestick wicks?
A long lower wick means buyers rejected lower prices and pushed back up. A long upper wick means sellers rejected higher prices and pushed back down. The wick shows you who won the fight inside the candle.
Do candlestick patterns work in crypto and forex?
Yes. Candlesticks reflect human emotion, fear and greed, so they work on any liquid chart. I have traded crypto using the same patterns I use on stocks. The context rules still apply.
What software is best for reading candlestick charts?
I have used TC2000 for over 20 years. Clean charting, powerful scanning, and every chart example in this article was pulled from it.
How long does it take to learn candlestick patterns?
You can learn the basics in a week. Learning to read them in context with volume, moving averages, and market conditions takes months of screen time. That is why we spend the first two weeks of the 60-Day Bootcamp building this exact foundation.
What is the best candlestick pattern for day trading?
For day trading I lean on the shooting star into a parabolic short and the orderly pullback patterns like the rising three methods into the 9 EMA. Both work because they pair a clean candle with a high-conviction context.
Why do my candlestick trades keep failing?
Almost always because you are trading the pattern in isolation, on too short a timeframe, or with no volume behind it. Fix the context and the win rate changes.
Want to see how I use these patterns on live trades. I break down real setups every week on YouTube using the exact reads in this guide. Subscribe here so you do not miss the next one.
Join my 60-Day Trading Bootcamp, the longest-running live trading education program in the world. We trade live every single day. You will learn the setups, the psychology, and how real traders manage risk. 👉 Click here to join now
This guide is part of our complete day trading strategies library covering the setups professional traders use every day.
About Kunal Desai
Kunal Desai is the CEO and founder of Bulls on Wall Street. A professional trader since 2007, he has navigated every major market cycle, from the 2008 financial crisis to today high-volatility environments. Having mentored 7,000+ students through his live trading bootcamps, Kunal trades live every morning in the Bulls on Wall Street Trading Chatroom and is dedicated to teaching real-world execution and high-probability strategies. Based in Miramar Beach, Florida.
Connect with Kunal: Read his full story | Instagram | YouTube