

Updated July 2026
I have been trading since 1999 I was just a teenager at the time falling in love with the markets. I was just entering college and determined to figure how how to trade for a living. . For the first decade, I was like every other retail trader — trying to predict earnings results, guessing on fundamentals, sizing into my conviction, and losing money when the market surprised me. I went full-time in 2007 and founded Bulls On Wall Street in 2008. Since then, I have trained over 7,000 students. What I learned from running a trading community for 16 years is this: the traders who survive earnings season are not the ones trying to predict earnings outcomes. They are the ones who trade the technical setup after the news hits.
Here is the truth nobody wants to hear. In today's market, the relationship between earnings and stock price movement is broken. I have watched stocks beat earnings by huge margins and drop 20%. I have watched stocks miss earnings and gap up 10%. The correlation between earnings quality and stock movement is nearly random — wild west territory. What matters instead is HOW the stock gaps, WHERE it gaps to, and whether the technical setup supports follow-through.
One more thing. This system is not limited to earnings. A major press release, a CEO change, an FDA approval, a crypto treasury announcement — any catalyst that gaps a stock 3%+ with volume gets treated the same way. The chart does not care WHY the stock gapped. It only cares about the technical setup after the gap. BMNR was a press release, not earnings. I traded it the same way. It went from $15 to $160 in three days.
This guide walks you through the exact system I use every earnings season and beyond. I will show you the T-BONE Framework for finding the biggest movers, the pre-market routine that separates winners from guessers, real examples from my own trading, and the position-sizing playbook for gap trades that can run for months.
The Biggest Misconception About Earnings Trading
Most retail traders make the same mistake: they buy before earnings hoping to guess the direction. They build positions the day before earnings, set alerts, and wait. Some nights they are up 30%. Some nights they are destroyed. This is not trading. This is gambling.
BOWS never guesses before earnings. The risk-reward is a crapshoot. You are betting blind on corporate guidance, revenue beat, margin expansion, and analyst sentiment. Too many variables. Too much uncertainty. Too much chance of gap-down on good news or gap-up on bad news.
Here is what we do instead: we trade post-earnings only.
The process is mechanical. On earnings day, we run a pre-market scan at 8 AM looking for stocks gapped 3% or more with minimum 50K shares of pre-market volume. We flip through each one and ask a single question: is the daily chart clean? Is this stock breaking out of a big range? Is it a neglected stock clearing long-term supply?
If yes, we put it on the watchlist. Then at 9:30 AM, we use intraday patterns — ORB, first pullback buy, VWAP trade — on the 5-minute chart to pinpoint entries. We are coupling the big picture earnings breakout with smaller timeframe BOWS intraday patterns.
This removes emotion. This removes guessing. This removes the 50-50 coin flip and replaces it with a technical system that has edge.
The T-BONE Framework: How to Find Earnings Breakouts Worth Trading
Over the last 19 years, I have noticed something repeatable about stocks that make the biggest moves on earnings. The best earnings plays are not the ones that beat estimates by the most. They are the ones that fit a very specific technical profile. I call it the T-BONE Framework.

T = 10% Short Float
B = Big Base
O = 100 Million Float or Under
N = Neglected
E = Earnings (Ultimate Catalyst)
Let me explain each component.
T: Short Float Around 10%. Heavily shorted stocks — 20%, 30%, 50% short float — have massive potential for gap-up squeezes on positive surprises. When earnings hit and the thesis changes, short-sellers are forced to cover. They buy to close positions. This buying pressure compounds the initial gap-up. Look at GME and AMC during their squeeze phases. Those were not fundamental stories. Those were neglected stocks with massive short floats that caught unexpected upside and sent shorts scrambling.
B: Big Base. The stock has been consolidating for weeks or months. The range is clear. There is a bottom and a top. Volume during consolidation is low. Nobody cares. The stock is in equilibrium. Then earnings hit with surprise and the stock breaks out of the base. That is when the real move starts.
O: 100 Million Float or Under. Lower float stocks run further on the same percentage gap because there is less supply to exhaust. A 3% gap-up on a 100 million share stock is 3 million shares changing hands. A 3% gap-up on a 500 million share stock is 15 million shares. Which one is easier to absorb in a single morning? Lower float always runs further.
N: Neglected. The stock has been beaten down or forgotten. Analyst coverage is minimal. Retail interest is near zero. Then earnings surprise and the narrative changes overnight. Traders who never heard of the stock five minutes ago are now discovering it. This creates fresh buying pressure day after day as more people become aware of the move. Think of MU before it made its big run.
E: Earnings (Ultimate Catalyst). The earnings announcement is the trigger. But it only works if the first four components are in place. If the stock has massive short float, a clean base, low float, is neglected, and then earnings surprise — you get a multi-day runner that can drift for months.
Every Sunday, I run a scan in TC2000. I look for stocks that are up 25% or more during the week. I study what made them move. Most of the time, they fit the T-BONE Framework. These are the setups worth learning.
Why We Only Trade Post-Earnings
The hardest part of trading earnings is accepting that fundamentals do not predict direction. I have seen companies miss earnings by 20% and gap up 15%. I have seen companies beat earnings by 50% and gap down 10%. The market is pricing in multiple variables you cannot see: hedge fund positioning, sector rotation, institutional calendar rebalancing, retail sentiment.
Trying to predict this is futile.
I do not hold positions into earnings reports. I never have in all my years of trading. It is a crapshoot, and the current cycle is the loudest proof I have ever seen. Micron reported on June 24, 2026: 41.5 billion in revenue, up more than four times year over year, 25.11 in EPS, gross margins near 85 percent. One of the most profitable quarters any chipmaker has ever printed. Within two weeks the stock was trading below where it sat before the report.
Samsung did the same thing in July. Operating profit up 19-fold. Beat forecasts. Sold off 7 percent the next day and dragged the whole memory group down with it.
Record earnings. Red stock. Just because a company has good earnings does not mean it goes up. So much depends on where we are in the market cycle and what was already priced in. That is why the reaction is the trade, not the report.
Instead, we wait for the tape to show us what the market thinks. The moment earnings hit after-hours, the pre-market session tells us everything. If a stock gaps 3%+ with 50K+ volume, the market has made a decision. The buyers are there. The conviction is there. Now we read the chart to see if the move will continue.
This is where BMNR and RDDT teach completely different lessons.

The BMNR Trade: From $15 to $160 in Three Days (Press Release Gap)
BMNR was not an earnings play. It announced a crypto treasury play on June 30th with an all-star investor list attached — a press release, not a quarterly report. But this is the whole point of the system. The chart does not care why the stock gapped. The news was significant enough to gap the stock hard on the announcement. It gapped to $15 pre-market with massive volume — real institutional interest. I trade PR gaps exactly like earnings gaps. Same scanner. Same checklist. Same intraday patterns.
At 9 AM, I flipped through the stock. The daily chart was clean. The stock was clearing long-term supply levels. It had a big base beneath it. The pre-market volume was strong. Every box checked.
I added it to the watchlist. At 9:30 AM, I used standard intraday patterns. ORB (opening range break) worked. First pullback to VWAP worked. The stock closed that day at $34 by the end of the day.

Then something magical happened. The cryptomania sector caught fire the next two days. Entire crypto sector rallied. BMNR was the cleanest technical setup in a hot sector. Three days later, the stock was at $160.
This is what happens when you couple earnings/news gap with clean technical setup with sector momentum with low float and low attention. The stock drifted higher on PEAD (post-earnings announcement drift) and every trader discovering it along the way became a buyer.
The RDDT Trade: When Good News Does Not Mean Good Trade
Reddit announced earnings on February 7th. It was a well-known company with decent earnings growth. The stock gapped up pre-market on positive sentiment. Traders got excited. People bought.
But here is what happened when I looked at the chart: the gap took the stock right into massive supply. The daily chart showed resistance at that exact level. There was nothing left to break above. The stock was boxed in.
Furthermore, the current market showed distribution in tech. Momentum was weak at that level. The technical picture was dirty.
I made a decision: skip this trade. Many traders in my community asked me why I was not in it. I told them to look left. There is supply sitting right here. This stock will get rejected.
Within an hour, that is exactly what happened. The stock rolled over. Traders who bought the gap-up got stopped out. The lesson: good earnings does not equal good trade. You must couple earnings news with clean technical analysis. RDDT had the news. It did not have the chart. That mismatch meant failure.

The PENG Trade: A Textbook Earnings ORB (July 2026)
Here is what this looks like in real time. Penguin Solutions reported after the close on July 7, 2026. Adjusted EPS of 84 cents against a 56 cent estimate, a 50 percent beat. Revenue of 479 million, up 48 percent year over year. And they raised full year guidance on both sales and earnings.
Now run it through the checklist. AI stock in a strong multi-month uptrend. Showing relative strength while the rest of the semiconductor group was getting decimated. A 50.6 million share float. Real catalyst, real numbers, raised outlook. This is exactly the profile.

When a stock gaps like this on real news, the first thing I am looking for is one of two setups: an opening range breakout or a first pullback. PENG gave a textbook ORB. The opening range topped out right around 68. Price coiled, then broke through with volume. I took the break at 68.05 with a stop under VWAP. Risk was defined the moment I entered. The stock closed the day up more than 25 percent.
No guessing the night before. No holding through the print. The report hit, the market voted, the chart set up, and the trade came to me.
The Complete Pre-Market Routine: How to Start Your Day
I wake before sunrise. I currently wake at 6:15 AM. My son Colt and I take a drive to the beach in Destin, Florida. We watch the sunrise. I walk for an hour while he plays in the sand, chases birds, builds castles. My wife gets to sleep in.
This is not wasting time. This is the most important part of my trading day.
Most retail traders wake up at 6 AM and sit at their computer immediately. They stare at charts. They analyze. They build anxiety. By the time the bell rings at 9:30 AM, they are already mentally exhausted. They are reactive, not proactive. They get stopped out because they lack the mental clarity to follow their system.
I walk for an hour, clear my head, enjoy my son, reset my nervous system. When I sit down at the computer at 7:30-7:45 AM, I am centered. I am focused. I have high energy for the 9:30 bell.
At 8 AM, I open TC2000. I have 90 minutes until market open. Here is the exact routine:
8:00 AM - Index Scan (15 minutes). I pull up 44 indexes on my dashboard. Which ones are breaking out? Which ones are trending? Which sectors are hot? This tells me which earnings gappers will have tailwind and which are swimming upstream. If QQQ is breaking out and IWM is weak, then tech earnings gappers have an advantage. If biotech index is hot, then biotech earnings surprise has an edge. Sector context is everything.

8:15 AM - Gap Scanner (20 minutes). I run my pre-market gap scanner. I set filters: stocks up 3% or more pre-market, minimum 50K shares pre-market volume, price between $5-200. I flip through each gapper. I am looking at the daily chart only. Is the chart clean? Is the stock breaking out of a big range? Is it neglected?
I quickly create a 6-10 name watchlist flagged with the level of cleanliness. Green flag = clean setup, high confidence. Yellow flag = decent setup, will require tight stops. Red flag = dirty setup, skip unless something changes.

8:35 AM - News Cross-Reference (10 minutes). I open the Trade Exchange news tab. I cross-reference my watchlist with news catalysts. Are my gappers earnings-related or PR-related? What is the narrative? I also check TC2000 notes for dilution risk, insider sales, or other red flags.
8:45 AM - Consolidate Watchlist (10 minutes). I narrow my 6-10 gappers down to my best 3-4 candidates using my trade entry checklist. I also add non-earnings trending stocks that are moving 5%+ on sector momentum. I combine for my final watchlist of 6-8 names. This is my universe for the day.
9:00 AM - Final Setup Check (10 minutes). I pull up daily charts for my top three candidates. I look left. I measure where the gap level sits relative to moving averages, prior resistance, consolidation bases. I take mental notes on stop loss placement and position sizing. I am not trading yet. I am preparing.
9:15 AM - Index/Sector Check (5 minutes). One more look at the broad market and hot sectors. Has context changed since 8:00 AM? If QQQ has rolled over and is now down 1%, my tech gappers just got weaker. If biotech is starting to break out, my biotech plays just got stronger.
9:25 AM - Breathing (5 minutes). I close my charts. I breathe. I prepare mentally for the bell. I remind myself: follow the system, scale into winners, respect stops, take profits on velocity.
9:30 AM - Market Opens. I start with 0.5 size on the first trade. I feel out the volatility. I watch price action on my top three candidates. If the first trade hits and the pattern works as expected, I can size up on trade two. If it misses or shows weakness, I stay small and wait for patterns to confirm.
The difference between traders who make $500 daily and traders who make $5,000 daily is this routine. One trader wakes up at 9:30 and starts looking for plays. Another trader has already analyzed 200 stocks in the pre-market and is ready to execute a pre-planned watchlist.
Position Sizing: Income Trades vs. Account Builders

There are two types of earnings trades. Understanding the difference determines your position size and your profit per trade.
Income Trades are daily scalps. You use intraday patterns. You get in, you get out. You make $300-500 per trade. You do this 4-5 times per week during earnings season. This pays your bills. This is your baseline income. These are small position sizes — 0.5% account risk per trade.
Example: TSLA flags at $420. You buy 100 shares. You get a 1-2 point quick move. You make $100-200. You exit. Done. Next trade.
Account Builders are rare and unique. These are earnings breakouts with multi-day PEAD. These are stocks that run 5-10% per day for a week. These have high reward-to-risk AND high win ratio — the holy grail of trading. These deserve bigger positions.
Example: BMNR gap breakout with clean chart and low float. You size up to 2-3% account risk. You hold for multiple days. You make $2,000-5,000+ per trade because the stock is running 20-40% from your entry.
The biggest moves in markets come from account builder earnings trades. The compounding from one BMNR-type trade per quarter makes your account explode. But you have to recognize it. You have to have the discipline to size small on income scalps and size bigger on rare, unique setups with high edge and high probability.
Most traders do the opposite. They size big on every trade and get stopped out on the dirty chart gappers. Then they size small on the elite setups because they are scared after losses. Backwards thinking.
How to Read Clean vs. Dirty Charts Before Market Open

The difference between a 50% winner and a 200% winner comes down to one thing: reading whether the chart is clean or dirty before 9:30 AM.
A clean chart means the stock is breaking out of consolidation or neglect into white space. There is no supply immediately above the gap level. The daily chart shows clear room to run.
A dirty chart means the stock is gapping into resistance. The stock gaps up and immediately hits the 200-day moving average or prior resistance or EMAs. The gap has nowhere to go.
AAOI is the textbook earnings example. Stock was consolidating in a tight range for weeks. Nobody cared about it. Then actual earnings came and surprised to the upside. It gapped up and broke out of the consolidation cleanly. The 50-day and 200-day were below the gap level. The stock had room — white space above. Intraday patterns worked beautifully. ORB triggered, first pullback to VWAP held, and the stock ran for days on PEAD. This is what a clean earnings gapper looks like when everything lines up.

RDDT was dirty. Stock gapped up but immediately hit resistance. The EMAs were right there. Prior resistance was right there. The stock had no room above the gap. Intraday patterns failed. The stock faded.
Before 9:00 AM, pull up the daily chart for each gapper. Draw a horizontal line where the stock is gapping to pre-market. Look at the moving averages (9, 20, 50, 200). Are they above or below the gap level? Look at prior resistance, consolidation bases, all-time highs.
If the gap level sits below all moving averages with white space above, it is clean. If the gap level sits right at or above the moving averages or prior resistance, it is dirty.
This single check saves you from trading 70% of the dirty gappers that will fail by lunch.
The Intraday Patterns That Work on Earnings Gappers
Once you identify a clean earnings gapper, you use standard day trading patterns. The only difference is the follow-through is bigger because the underlying momentum is stronger.
Opening Range Break. Stock pushes at the open. Goes sideways for min 3 candles and takes out that range can be very powerful.
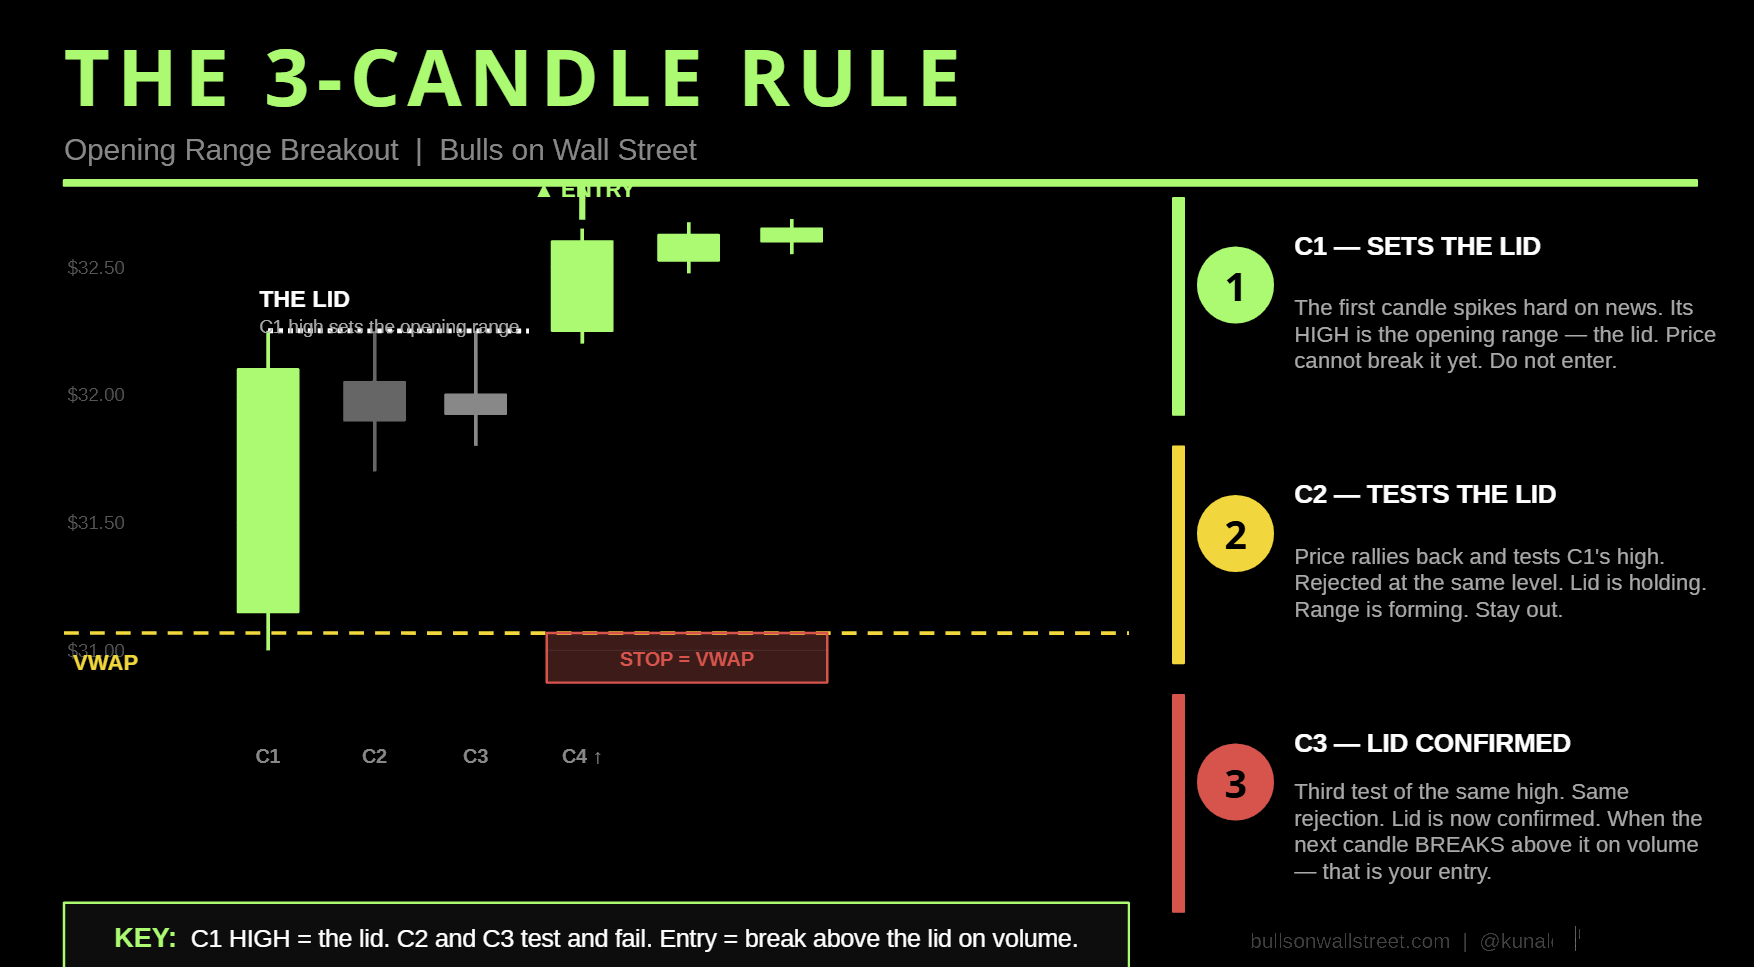

One warning on the ORB, because this is where I lost real money when I was newer. I would see the gap, feel the excitement, and buy the first candle. Sometimes the second. I was anticipating the range break instead of waiting for it. Inevitably the stock would pull back, stop me out, and then rip later without me. The dollar loss was small. The real damage was mental. By the time the actual setup triggered, my confidence was spent and I could not pull the trigger again. Wait for the range to form. Minimum three candles. Then trade the break.
First Pullback Buy. The stock gaps up 7%, runs hard the first 30 minutes, then pulls back 2% to VWAP or the 9 EMA. This is where real traders buy. You buy the pullback, you get another 3-5% move. On normal days, that move is 1-2%. On clean earnings gappers, the move is much bigger.
VWAP Trade. VWAP (Volume Weighted Average Price) tells you whether the stock is tight to fair value or extended. If the stock gaps up and closes at VWAP or slightly above, it is tight. It will run again. If the stock gaps up and is $3 above VWAP by mid-morning, it is extended. It will need to come back in.
These patterns work on earnings gappers the same way they work on normal stocks. The velocity is just higher because of the gap catalyst.
T-BONE Stocks to Add to Your Sunday Watch List
Every Sunday, run this scan in TC2000: find all stocks up 25% or more in the past week. Study what made them move.
Most of the time, these are earnings gappers that fit the T-BONE Framework. You will start to recognize the pattern.
Look for stocks with:
- Short float around 10% (short squeeze setup)
- A clear multi-month consolidation base
- Total float under 100 million shares
- Minimal analyst coverage and institutional ownership
- Recent earnings surprise or major news catalyst
When you find these, add them to a future earnings watch list. These are the stocks that run the hardest when earnings hit.
Real Examples from My Trading
BMNR: $15 to $160 in Three Days (Press Release Gap). This was NOT an earnings play — it was a press release announcing a crypto treasury with an all-star investor list on June 30th. But the system does not care about the catalyst label. Stock gapped to $15 pre-market with real volume. Clean daily chart. Low float. Neglected name suddenly getting attention. Used ORB and first pullback patterns on the open. Stock closed at $34 day one. Sector momentum caught fire over the next two days. Stock ran to $160. Wildly different outcome from RDDT because the chart was clean, float was low, and the sector had tailwind. I trade PR gaps exactly like earnings gaps — same scanner, same checklist, same patterns.
RDDT: Gapped into Supply and Failed. February 7th earnings, good growth story, real company, gapped up pre-market. But the gap took the stock right into resistance. Daily chart showed supply sitting right at the gap level. EMAs were overhead. Current market showing distribution in tech. I skipped the trade. Stock rolled over within an hour. Traders who bought got stopped out. The lesson: news does not overcome bad technicals.
ENPH: From Laggard to Multi-Month Runner. Stock was a consensus laggard before earnings. Sitting in a tight range for months, unloved, ignored. Earnings came with better-than-expected results. Stock gapped 20% but the chart was clean. Daily chart was forming a base. No supply above the gap. The entire narrative around the company shifted. Over the following months, the stock drifted higher on PEAD as more institutional money recognized the story change. Same setup as BMNR but over a longer timeframe.

Position Sizing Rules for Different Market Conditions
During earnings season in a strong market (QQQ making all-time highs), clean earnings gappers with low float run farther and faster. I size bigger because win ratio is high. 2-3% account risk per trade is justified.
During earnings season in a distribution market (QQQ rolling over, tech selling), earnings gappers are trickier. Stocks that beat earnings go down. Stocks that miss go up. It is wild west. I size smaller. 0.5-1% account risk per trade. I focus on neglected small-cap runners where the chart has the strongest setup.
Income scalps: 0.5% account risk. Quick 1-2 point moves. Take profits on velocity.
Account builders: 2-3% account risk. Hold for multiple days. Let winners run.
Dirty chart gappers: 0.25% account risk. Tight stops. Quick exits.
The Sunday Homework Ritual
Every Sunday evening, spend 30 minutes on earnings preparation:
- Pull up the earnings calendar for the coming week. Mark which names are reporting.
- Add 10-20 of them to TC2000 watch list. Study their daily charts.
- Which ones fit the T-BONE Framework? Which ones have clean consolidation bases?
- Note the float for each. Anything under 100 million, you flag higher.
- Note the short float. Anything around 10%, you pay attention.
- Note the sector context. Is the sector hot or weak?
- Create a pre-prepared watch list sorted by chart cleanliness.
By Monday morning, you are already ahead of 95% of retail traders. You are not scrambling at 9:00 AM. You are executing a pre-planned system.
Why Guessing on Earnings Outcomes Fails
Most retail traders build positions days before earnings based on their prediction of the earnings surprise. They read estimates, they read guidance, they read analyst sentiment, and they make a bet.
Sometimes they win. Often they lose. But the math never works because they are fighting randomness.
The other version of this mistake happens after the report. Students see the headline, hear the hype on social media, and buy in the pre market trying to front run the pop. Same disease, different hour. You are still guessing. Pre market is thin, spreads are wide, and the real auction does not start until 9:30. Let the open happen. Let the range form. Then trade what is actually there.
The data shows that in today's market, the relationship between earnings beat/miss and stock direction is near 50-50. That is not an edge. That is a coin flip.
Additionally, most traders do not understand that earnings estimates are not set in stone. On the day of earnings, estimates change. Guidance changes. Market sentiment changes based on forward-looking signals. You cannot predict this from Tuesday.
What you CAN predict is the technical chart and the momentum. If a stock gaps 3%+ on real news with real volume, you can read the daily chart and see whether it has room to run. If yes, you enter intraday patterns. If no, you skip.
This removes emotion. This removes guessing. This removes the 50-50 coin flip.
Risk Management Rules for Earnings Trades
Earnings gappers are volatile. Volatility is both profit and risk.
Rule 1: Stop Loss is Non-Negotiable. Stop loss goes under the bottom of the support for the pattern! Orb the stop is under vwap. If itst the first pullback buy the stop loss goes under the bone zone! Each pattern has its own stop loss rules but they are all tight.
Rule 2: Scale Into Positions. If its a longer term trade. For day trades its a 1 shot 1 kill. Do not ever add to a loser.
Rule 3: Take Profits on Velocity. If a stock uses up its intraday ATR take profits as its usually going to pullback. I tend to sell half at those point and raise my stop losses.
Rule 4: Trade Multiple Setups. 3 stages to the trading day. Morning: ORB, First pullbacks, Red to Greens. Mid day: Vwap patterns, flags, larger pulls. End of day: Reversals, Vwap patterns, Cross overs.
Rule 5: Keep a Trading Journal. Which gappers worked? Which failed? What was different? Over time you will see patterns. You will notice you win 70% on clean neglected charts and 40% on dirty charts. You will notice low float runners work 90% and mega cap gappers work 50%.
FAQ: Earnings Trading Questions Answered
Q: Should I trade earnings the same day they are announced?
A: You can, key is to wait for the market open then execute one of the bulls on wall street setups on it. The first pullback setup is one of my gotos on this along with the ORB.
Q: How much of my portfolio should I put into gappers?
A: I risk max 1% on a trade so if I get stopped out I lose 1% of my trade
Q: What is the ideal float for an earnings gapper?
A: There is no ideal float. They key is to just understand how float impacts how a stock moves. These days with algos and HFT's higher float stocks can have huge ranges but to really go nutty those 100% plus intraday moves you need a stock with a lower float under 100 million. Personally I like to trade clean plays regardless of float.
Q: Can I hold earnings gappers overnight?
A: Yes, if you get a good entry at the open and it trends that day you can carry into the next days.
Q: How do I know if a chart is clean after earnings?
A: Look for either a neglected range (stock going nowhere for months) or a clean consolidation base that is clearing levels.
Q: What is the best time to enter a gapper?
A: Day one, enter 30-60 minutes after open. Day two or three, use ORB or pullback patterns. Swing trading the PEAD, enter on pullbacks to moving averages.
Q: Should I trade gappers on both long and short sides?
A: Yes everyday when I run the gap scan I run it for stocks 3% moves. That could be +3% or more or -3%
Q: How do I avoid trading dirty charts?
A: Simple rule: if it does not look left to something meaningful, skip it. No base? No consolidation? No support? Then the gap is into a wall of supply and the trade will fail.
Q: Can I use TC2000 to find gappers?
A: TC2000 is the best tool for earnings gappers. Pre-market watch list shows all gappers sorted by percentage move at 9:00 AM. Scanner lets you find stocks with specific float, price, and volume characteristics. There are tons of tools out there. There are quite a few out there and tons of free tools too.
Q: What happens if a stock gaps but earnings do not materialize?
A: This will happen all the time. There could be another type of press release that is out. News is news. A huge contract can be just as big of a catalyst as earnings. The same playbook is used in those cases.
Q: How many earnings trades per day should I make?
A: Quality over quantity. One perfect setup beats three mediocre ones. If you find three clean gappers, trade all three with 0.5x size. If you find one elite neglected gapper, make that your focus.
Q: Is earnings trading better for day traders or swing traders?
A: Both. Day traders make money on intraday patterns the first day. Swing traders make money on PEAD over days and weeks. Learn both.
Q: What if I miss an earnings gapper?
A: Do not chase extended moves. A stock up 30% at 10:00 AM is dangerous. Let it cool. If the chart is clean, it will flag and give you another entry. Missing a play is better than chasing it into resistance.
Bottom Line: This Is How Professionals Trade Earnings
Since 1999, earnings season has been the most consistent source of opportunity in my trading. Earnings happen every quarter. They are predictable. They are scannable. The patterns are repeatable.
You now have the T-BONE Framework to identify setups worth trading. You have the pre-market routine that separates winners from guessers. You have real examples from my own trading showing what works and what fails.
To sharpen your chart-reading skills for earnings gappers, study our Candlestick Chart Patterns PDF — a complete visual guide to reading reversal and continuation patterns like hammers, engulfing candles, and evening stars on any timeframe.
The step from reading this article to making money is execution and experience. Start with the 60-Day Live Trading Bootcamp if you want structured training and live accountability during earnings season. The bootcamp walks you through earnings plays live, showing you exactly which setups to take and which to skip. You will see the patterns fire in real-time and learn the discipline of winners.
If you want more earnings examples and daily trade breakdowns, subscribe to the Bulls On Wall Street YouTube channel where I post earnings trades during season.
Set up TC2000 at TC2000.com/pricing/Bulls. You cannot trade earnings without a proper scanner. It is like fishing without a rod.
Earnings season is coming. Start preparing now. Build your watch list. Study charts. Review the T-BONE Framework. By the time the first clean gapper comes, you will be ready.
About the Author
Kunal Desai is the CEO and founder of Bulls on Wall Street. A professional trader since 2007, he has navigated every major market cycle — from the 2008 financial crisis to today's high-volatility environments. Having mentored thousands of students through over 79 intensive trading bootcamps, Kunal is dedicated to teaching real-world execution and high-probability strategies. Based in Miramar Beach, Florida, he balances the intensity of the trading desk with a focus on fitness, family, and performance cars.
This strategy is part of our complete day trading strategies guide covering the setups professional traders use every single day.
Connect with Kunal: Read his full story here | Instagram | YouTube