Trading involves substantial risk of loss. This content is educational only — not financial advice. Past performance does not guarantee future results.
I have been day trading stocks since 1999. I went full-time in 2007 and founded Bulls On Wall Street in 2008. Since then, I have trained over 7,000 students through the 60-Day Live Trading Bootcamp. What I have learned trading since 1999 and teaching 79+ bootcamp classes is this: day trading is not about finding one magic setup. It is about building a repeatable system of scanning, planning, executing, and reviewing, and doing it every single day with discipline.
This page is the hub for every day trading strategy I teach at BOWS. Each strategy below links to a full deep-dive guide with real trade examples from my own account, step-by-step execution rules, and the exact tools I use. Whether you are a beginner learning your first day trading strategy or an experienced trader looking to sharpen your edge, start with the strategy that fits your current skill level and work through them in order.
The Bulls on Wall Street day trading system is built on five named momentum setups: the Opening Range Break, the First Pullback Buy, VWAP trades, earnings gap plays, and the parabolic short. Every one of them is entered and managed off the Bone Zone, the shaded area between the 9 and 20 EMA, and every one is governed by the 1% Rule and the Free Trade exit. I am Kunal Desai, trading since 1999 and full time since 2007, and I have taught this exact system to over 7,000 students through the 60-Day Trading Bootcamp since 2008.
Updated June 2026.
Most trading education teaches strategies in isolation. You learn the ORB. You learn pullbacks. You learn VWAP. But nobody tells you how they connect into a single, cohesive daily process. That is what separates BOWS from everyone else.
Lorem ipsum dolor sit amet, consectetur adipiscing elit. Suspendisse varius enim in eros elementum tristique. Duis cursus, mi quis viverra ornare, eros dolor interdum nulla, ut commodo diam libero vitae erat. Aenean faucibus nibh et justo cursus id rutrum lorem imperdiet. Nunc ut sem vitae risus tristique posuere.See how the 60-Day Bootcamp stacks up in my ranking of the best day trading courses.
Here is how the pieces fit:
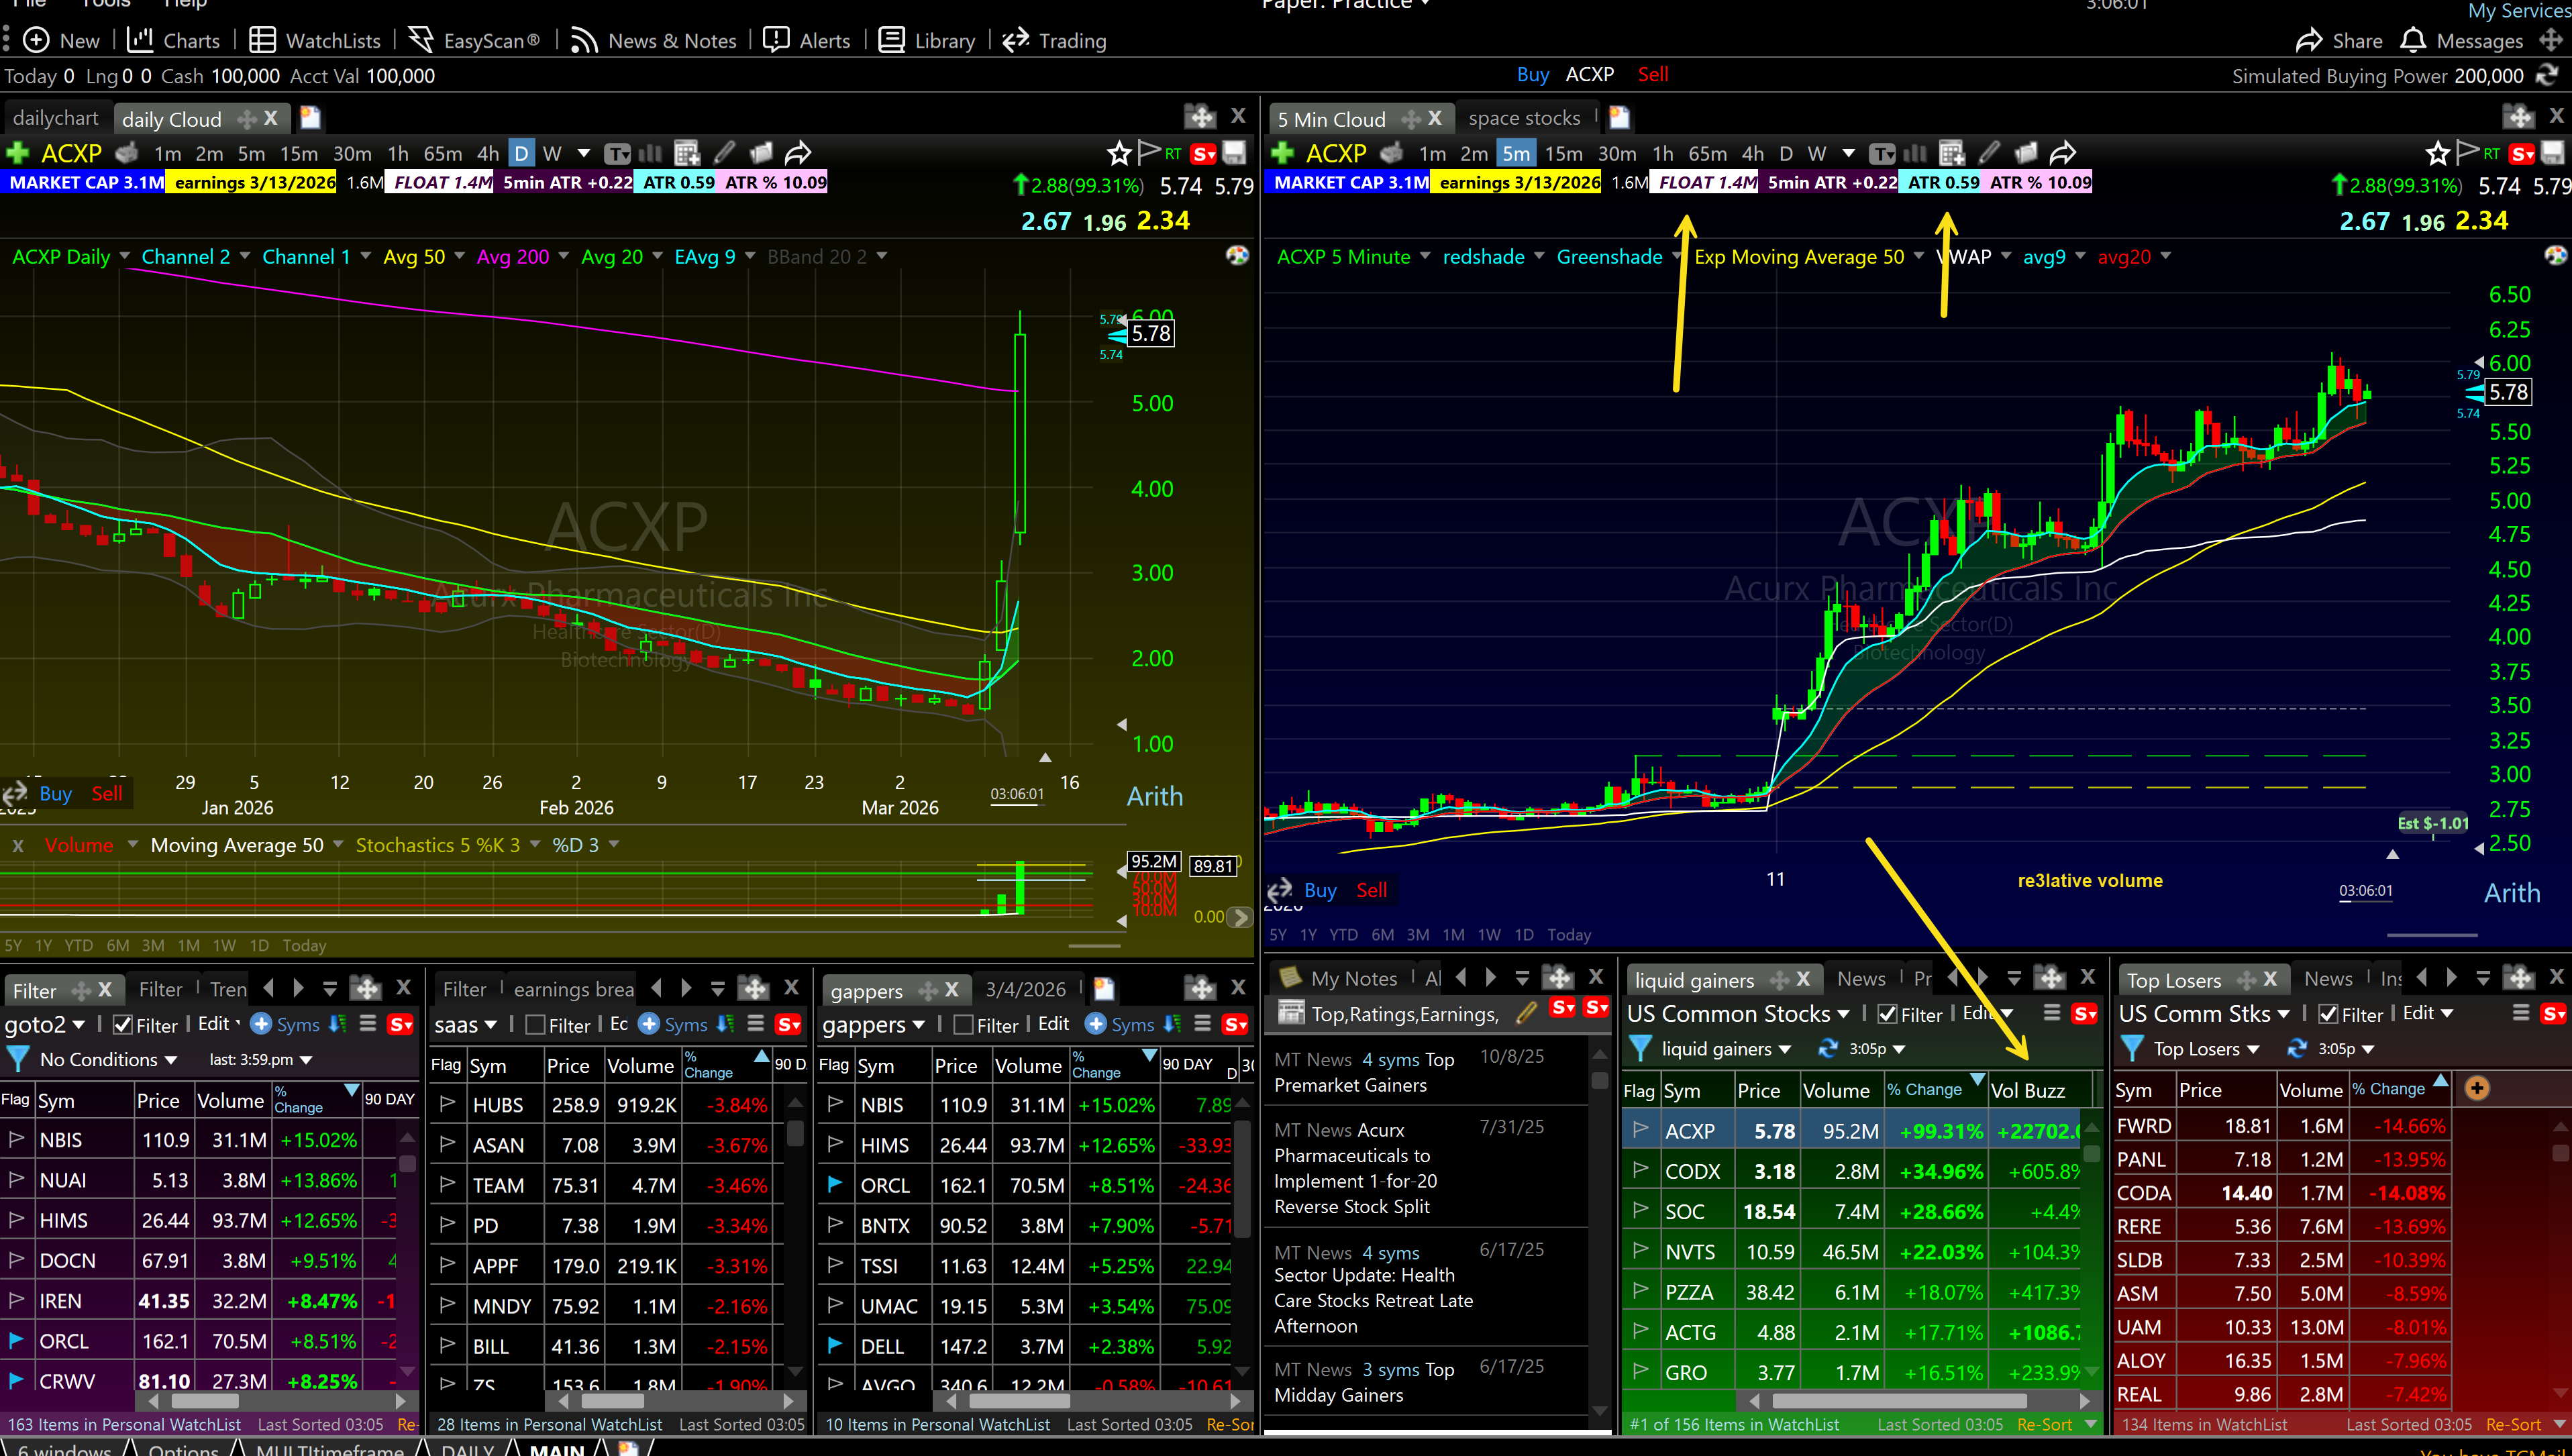
Every morning before 8 AM, I wake up, spend time with my son Colt, and clear my head. No screens. No charts. Just fresh air and perspective. When I sit down at the computer at 8 AM, I am centered and focused. I run four scans in TC2000 — pre-market gappers, liquid gainers, liquid losers, and sector ETFs — to build a 5-8 name watchlist. I cross-reference each name against my pre-trade checklist to separate clean setups from dirty ones. By 9:25 AM, I know exactly which stocks I am trading and which patterns I am looking for on each one.
At the bell, I execute using the specific intraday patterns below. The Opening Range Break fires first in the 9:30-10:00 window. The First Pullback Buy fires 20-45 minutes after the open when momentum stocks pull back to the VWAP or 9 EMA. And throughout the day, I manage risk using the rules in my risk management guide.
Every one of those risk rules lives in one place: my complete risk management system for day traders, covering the 1% Rule, the Free Trade, the Bone Zone, and the 3-Loss Rule.
This is not random chart-staring. This is a system. Scan. Filter. Plan. Execute. Review. Every single day.

Before diving into specific strategies, let me be clear about what separates a working strategy from a losing one. Most traders chase setups. They see someone make money on a reversal pattern, so they start looking for reversals everywhere. They lack a framework. They lack conviction. And most critically, they lack a system for managing risk.
A working day trading strategy has five components:
1. Clear entry conditions. Not "buy when it looks good." Specific. Mechanical. No ambiguity. When I trade an Opening Range Breakout, there is no question about whether price has broken the range or not. Binary. Objective.
2. Defined risk through stop loss placement. Where does the trade technically fail? That is where your stop goes. For an ORB, the stop is below the consolidation range. For a pullback buy, the stop is below the green candle that held the EMA. Objective. Technical. Mechanical.
3. Position sizing based on account risk, not gut feel. I use 1% account risk per trade as the standard. $30,000 account = $300 risk per trade. If the stop loss is $1.50 below entry, I buy 200 shares. If the stop is $0.50, I buy 600 shares. The risk stays constant. The position size flexes.
4. Confluence — multiple factors pointing the same direction. A green candle holding the 9 EMA is good. A green candle holding the 9 EMA while price is also at VWAP and the daily trend is up? That is excellent. Confluence means higher probability.
5. Mechanical scaling and profit-taking rules. Trail your stop using the 9 EMA. Scale out at 2x ATR distance from your entry. The best traders are not the ones who catch 50% moves. They are the ones who take consistent 1-2% gains across many trades. Compounding works.
These are the bread-and-butter patterns I trade every day and teach in the bootcamp. Each one has a full guide with real trade examples, entry and exit rules, and the exact TC2000 setup I use.
The ORB is the first pattern that fires every morning. In the first 15-30 minutes after the open, the stock establishes a range. When it breaks above or below that range with volume, you enter. This is my highest-frequency setup during the first hour of trading.
I call ORB my sentimental favorite. Funny how that works — we always go after the loves that hurt us. ORB is fast. It should work right away. But it causes the most heartache. The pattern is beautiful until it fails, and then it fails spectacularly. The key is tightness — tight consolidation relative to the ATR means higher probability. A sloppy ORB with a wide range gets skipped every time.
Read the full Opening Range Break guide →
If ORB is the fast money trade, First Pullback Buy is the skilled trade — and it is my most successful. Highest probability, lowest risk, biggest win percentage AND highest reward. Anyone can buy a spike. Timing the pullback takes practice.
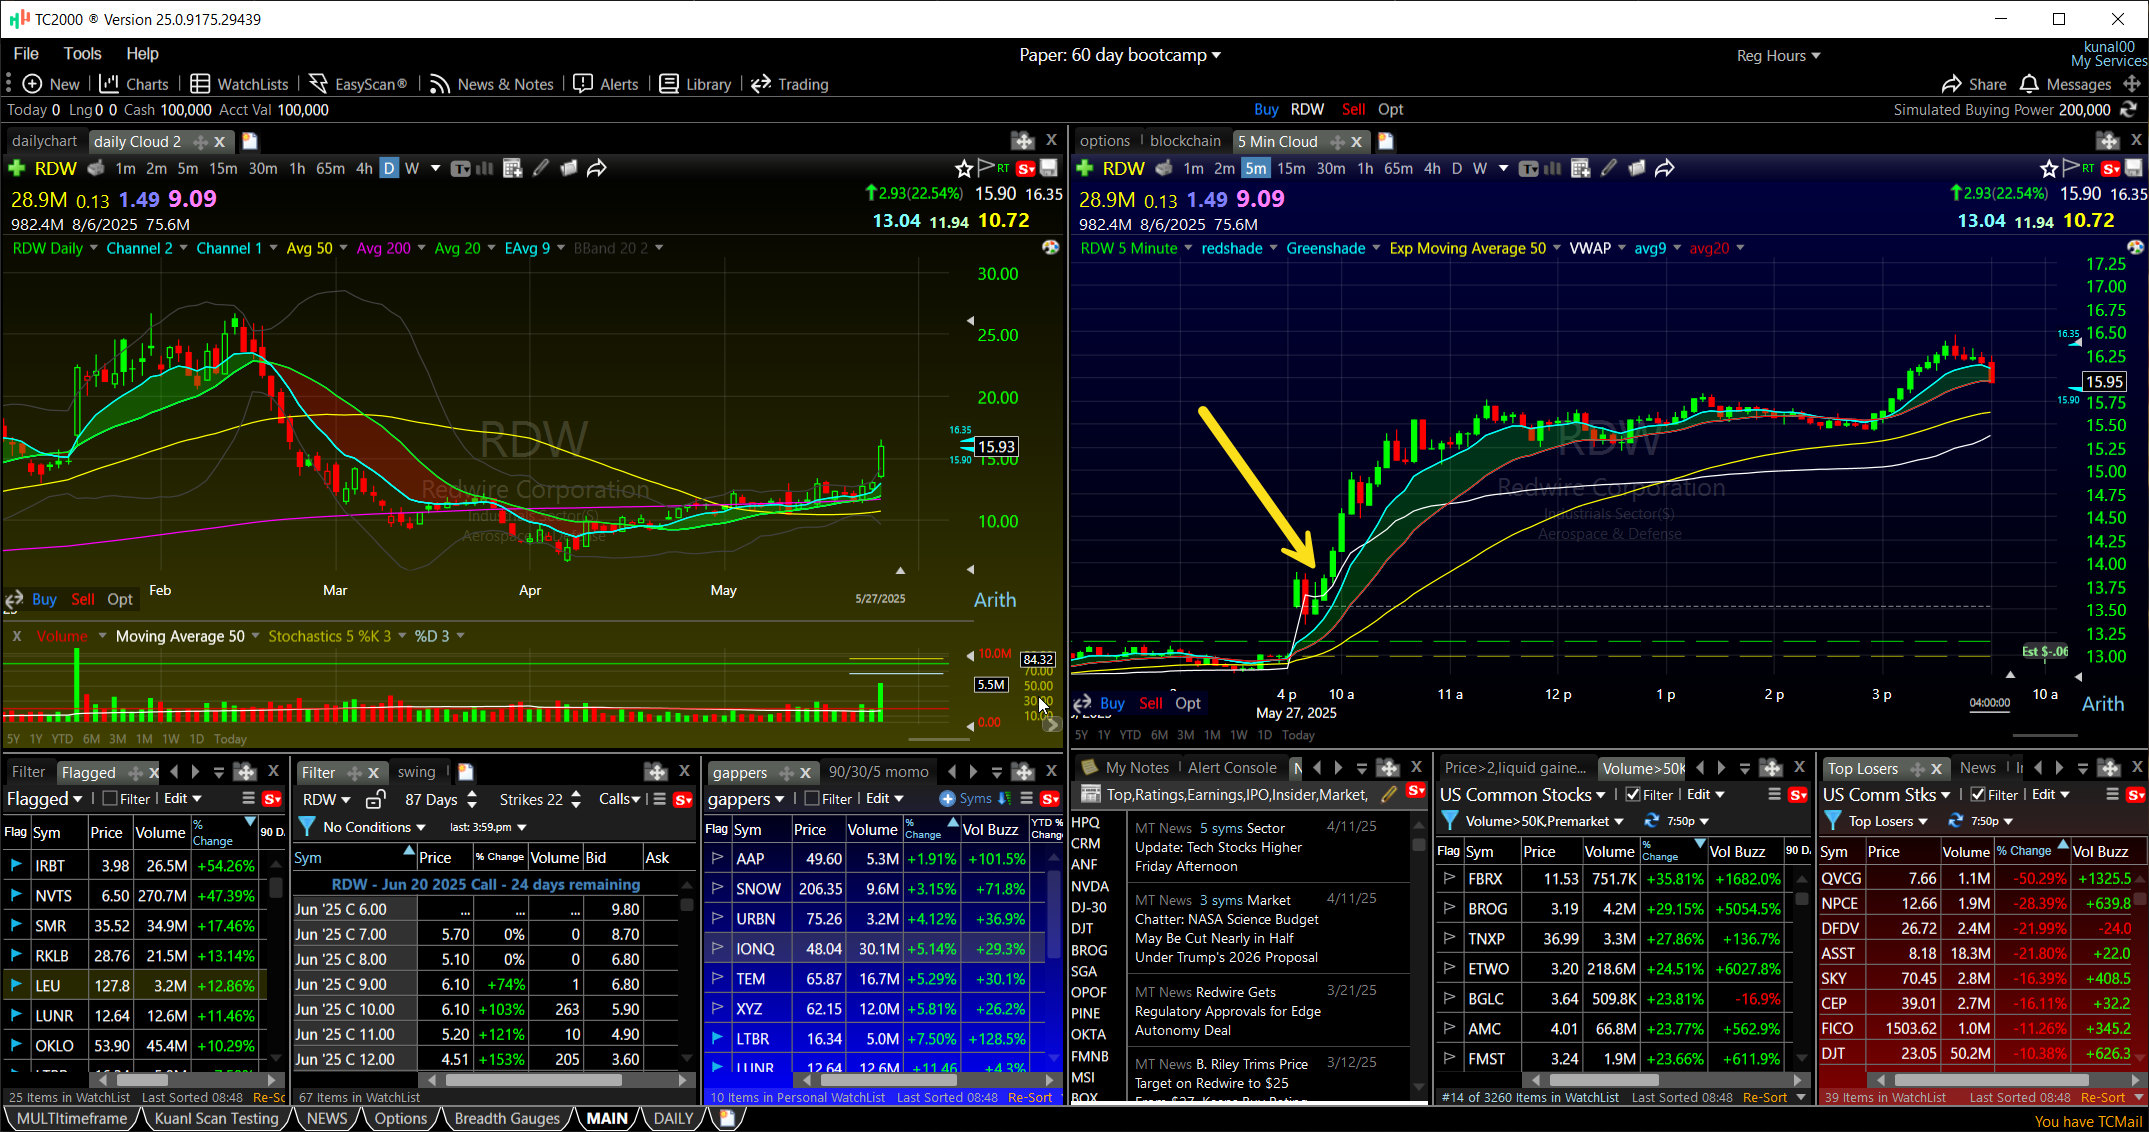
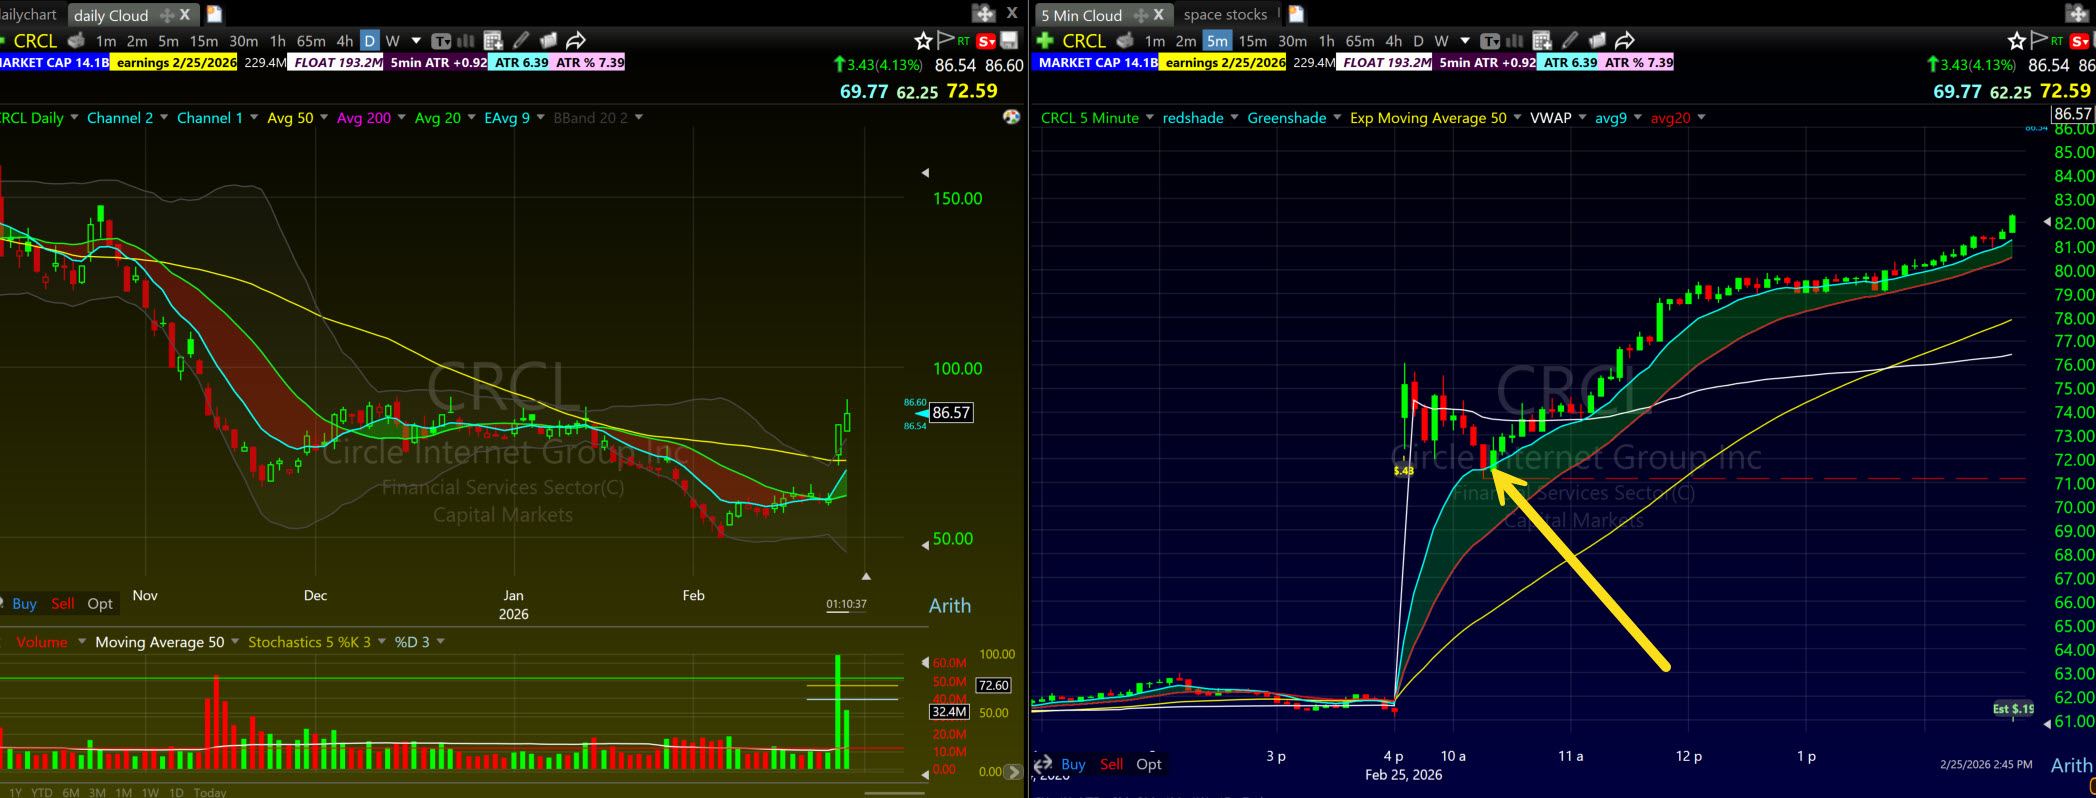
After a stock gaps up or runs hard on the open, it pulls back. The question is where. At BOWS, we buy the first pullback into the Bone Zone — the shaded area between the 9 EMA and 20 EMA on the 5-minute chart. When the pullback happens on decreasing volume and a green candle prints inside the Bone Zone, that is the entry. This pattern has the highest win rate of any setup I trade because you are buying into established momentum at a discount. If I were advising my son, I would say always the first pullback trade.
Read the full First Pullback Strategy guide →
VWAP — Volume Weighted Average Price — is the institutional benchmark that tells you whether a stock is trading above or below fair value for the day. When a stock pulls back to VWAP and holds, it is a buy. When it breaks below VWAP and fails to reclaim, it is a short. VWAP is the anchor for every intraday trade I take.
The critical confluence: VWAP alone is okay. VWAP + 9 EMA together = excellent. When price bounces at the intersection of both VWAP and the 9 EMA, win rates jump significantly. This is what professional traders call super support. If you do not understand VWAP, you are flying blind.
Read the full VWAP Trading guide →
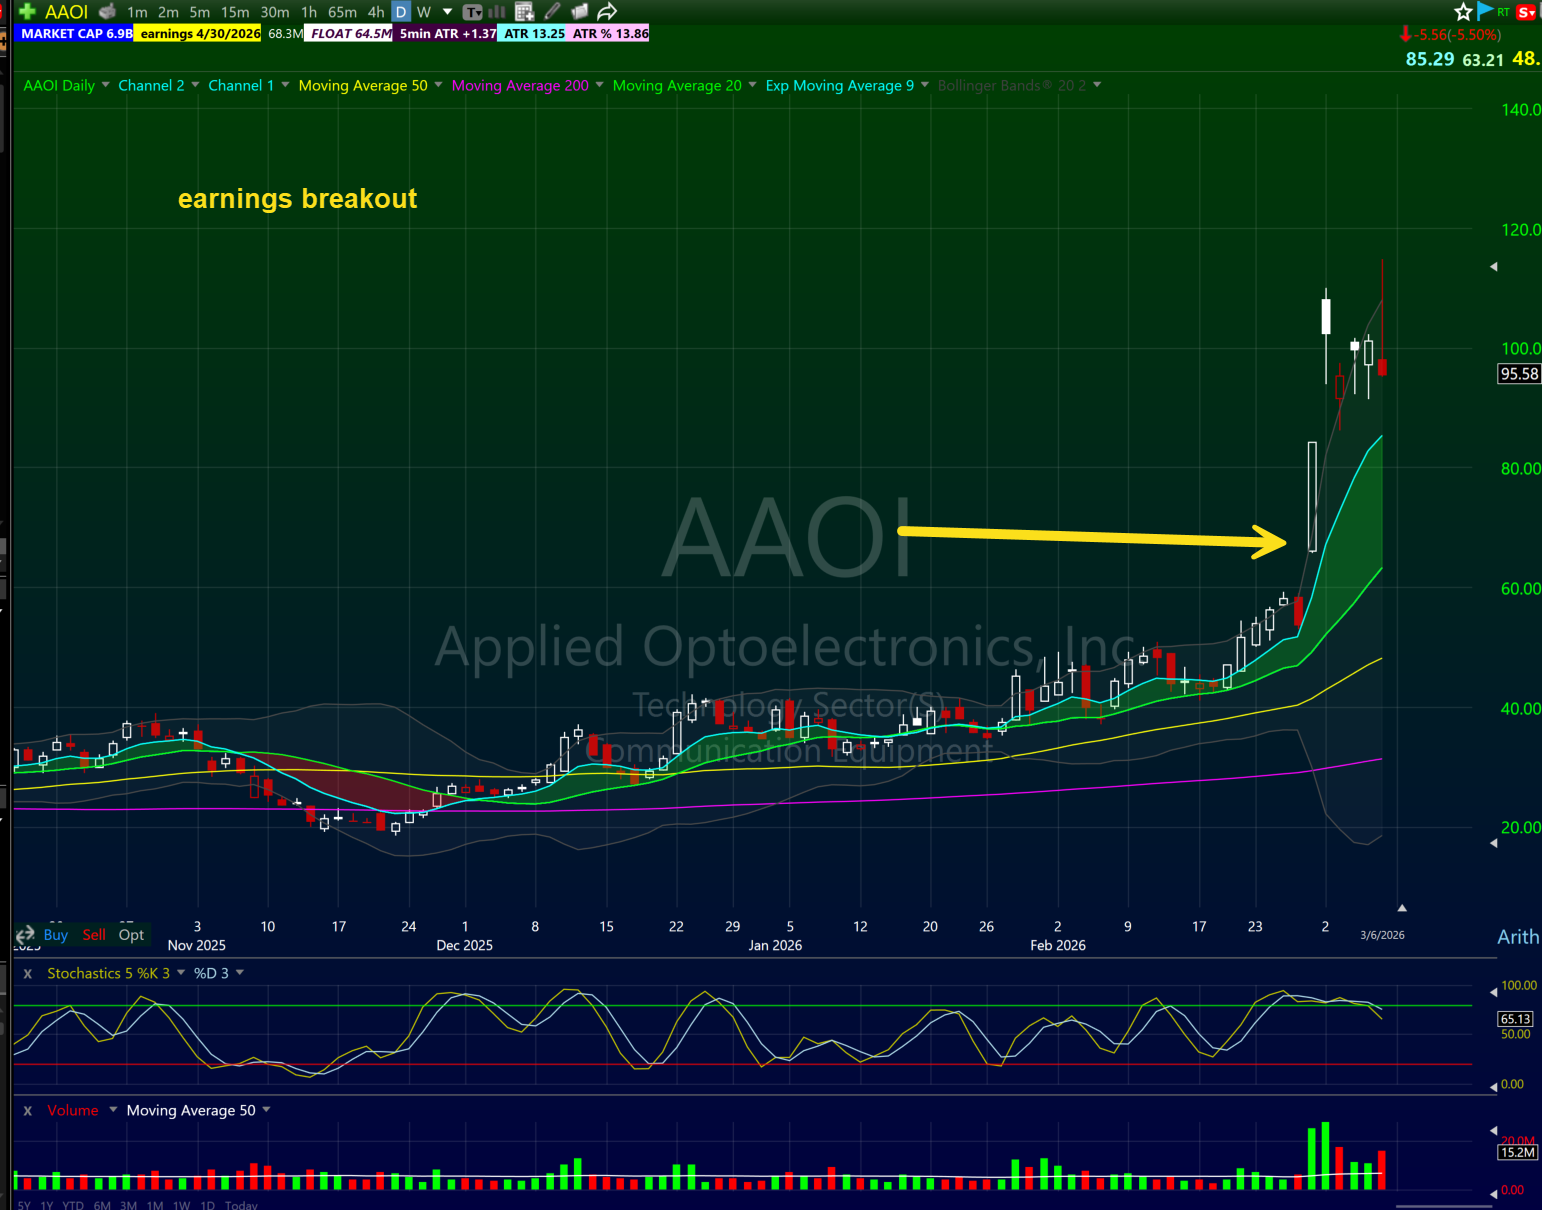
Earnings season is the single biggest source of opportunity in my trading calendar. But I never guess before earnings. I wait for the stock to gap, then I read the daily chart to see if the move will continue. I use the T-BONE Framework — 10% Short Float, Big Base, 100M Float or Under, Neglected, Earnings catalyst — to identify the gappers that run the hardest. This same system works on press release gaps, FDA approvals, and any catalyst that moves a stock 3%+ pre-market.
In 2008 when the market crashed, I was out there wheeling and dealing, trading inverse ETFs like FXP and FAZ going up 20-30% a day while everyone panicked. That built my following because I had a system. I was not guessing. I had rules.
Read the full Earnings Season Trading guide →
When a stock goes parabolic — running 50%, 100%, 200% in a single session — it will eventually crack. The parabolic short is one of the most profitable setups in day trading, but it is also one of the most dangerous. You need precise timing, tight risk management, and the discipline to wait for confirmation.
These are the hardest trades psychologically. Everyone is bullish. Everyone is long. Shorting feels counterintuitive. But that is the edge. When everyone is doing one thing, the market does the other. Afternoon is the best time — morning energy is spent, and the afternoon is when the reversal completes.
Read the full Parabolic Short Setup guide →
Every strategy on this page requires you to read candles. A green candle holding the 9 EMA. A red candle rejecting at resistance. A doji printing at VWAP. If you cannot read candlestick patterns fluently, you will mistime entries on every setup above. My candlestick guide covers the exact formations I look for when evaluating setups — the patterns that actually matter for intraday momentum trading, not the 75 textbook patterns nobody uses.
Read the full Candlestick Chart Patterns guide →
Strategies are useless without the right preparation. These guides cover everything that happens before and after you click the buy button.
Finding the right stocks to trade is 80% of the game. I use four scans every morning in TC2000 — pre-market gappers, liquid gainers, liquid losers, and five-day sector sort — to narrow 10,000+ stocks down to a 5-8 name watchlist. This guide walks you through every scan, every filter, and the exact workflow I follow from 8 AM to 9:25 AM. You need to see 100,000 charts before you feel comfortable identifying patterns in real-time — that is 1,000 charts per day over 100 days. Most traders skip this. They jump straight to live trading. That is why most traders fail.
Read the full Stock Scanning guide →
Before every single trade, I run a 5-point checklist: trend confirmation, volume verification, support/resistance check, risk-reward calculation, and position sizing. This checklist has saved me from more bad trades than any single strategy. If the setup does not pass all five points, I do not take the trade. Period. No exceptions. Professional pilots do not fly by feel. They use a checklist. Professional traders should do the same.
Read the full Pre-Trade Checklist guide →
The number one reason traders fail is not bad entries — it is bad risk management. I never risk more than 0.5% of my account on a single income trade and 2-3% on rare account-builder setups. I scale into positions. I take profits on velocity. I cut losers fast.
Read the full Risk Management Guide->
But understand: there are two types of trades. INCOME TRADES are daily scalps — flag pattern on TSLA, grab 1-2 points, $500, pays the bills. Little daily nuggets. Then there are ACCOUNT BUILDERS — rare, unique setups like parabolic shorts or earnings breakouts. Size those up to 2-3%, even 5% of account. These are different animals. This guide covers the complete risk management framework I have used since 2007.
Explore the complete Risk Management system →
If there is one concept that defines the BOWS trading system, it is the Bone Zone. The Bone Zone is the shaded area between the 9 EMA and 20 EMA on your chart. On the 5-minute chart, it is the pullback entry zone for day trades. On the daily chart, it is the pullback entry zone for swing trades. On the weekly chart, it signals longer-term reversals.
Here is why it works. When a stock is trending, the 9 EMA leads and the 20 EMA trails. The space between them represents healthy momentum — not too extended, not too weak. When price pulls back into this zone on decreasing volume, institutional buyers step in. They are buying at fair value within the trend. When a green candle prints inside the Bone Zone, that is your confirmation that buyers have taken control again.
You will see the Bone Zone referenced in every strategy guide on this page. It is the thread that connects the ORB, the first pullback, the VWAP trade, and the swing trading setups. Learn it. Trust it. It is the single biggest edge I teach.

Here is what these setups look like with real money on the line. June 9, 2026. NVDA broke green to red and I shorted the move, the same green to red setup from my parabolic short framework. Into the first flush I covered half at 206.50 and moved my stop to my entry price, turning it into a free trade. From there the stock kept getting rejected at the Bone Zone, so I trailed my stop down the 20 EMA and rode the trend until price finally broke back over the cloud. One trade. The setup got me in, the Bone Zone managed the exit, and the risk rules made it impossible to give back the gain.
Your edge changes throughout the day. The setups that print money at 10 AM do not work the same way at 2 PM. Understanding this is critical.
9:30 AM - 11:00 AM (The Opening Range): This is where 70% of your edge lives. Volatility is high. Liquidity is best. Your primary setups: Opening Range Breakouts, First Pullback Buys, and Red to Green trades. Most trades should be 30-60 minute holds.

11:00 AM - 1:00 PM (The Midday Range): Volume declines. Action gets choppier. This is when deeper pullbacks form — VWAP bounces on stocks 2-4% extended from their morning spike. Also the best time for intraday flag formations that break out in the afternoon.
1:00 PM - 4:00 PM (The Afternoon): Lowest volume. Limited edge. But for traders who understand parabolic reversals and rubber band snapbacks, this is where dramatic short opportunities live. If a stock rallied 10%+ in the morning without consolidation, the afternoon is when it snaps down.
This framework — understanding which setups work when — prevents you from fighting the market during weak periods. According to FINRA's investor education resources, a significant percentage of active day traders underperform precisely because they trade the same approach regardless of conditions.
If you are new to day trading, do not try to learn everything at once. Here is the order I recommend:
This is the same progression I use in the 60-Day Live Trading Bootcamp. The bootcamp walks you through each strategy live, with real trades, daily accountability, and structured progression from simulator to live trading.
TC2000 is the only charting and scanning platform I use. I have tested dozens of platforms since 1999. TC2000 gives me the cleanest charts, the fastest scans, and the most customizable layout of anything on the market. Every scan, every chart setup, and every watchlist in my guides uses TC2000. If you are serious about day trading, you cannot trade without a proper scanner. It is like fishing without a rod. Use the Bulls referral link to get the best available pricing.
For live trade analysis and daily breakdowns, subscribe to the Bulls On Wall Street YouTube channel where I post real trades and pre-market analysis every Tuesday and Thursday at 9:00 AM EST.
Research from the Journal of Financial Economics consistently shows that traders with defined, systematic approaches to stock selection significantly outperform those who react to news and tips. The scanner is the system. Use it every day without exception.
The First Pullback Buy. It has the highest win rate, the clearest entry signal, and the most forgiving risk-reward of any pattern I trade. You are buying into established momentum at a discount — the 9 EMA/20 EMA Bone Zone tells you exactly where to enter.
The SEC Pattern Day Trader rule requires $25,000 minimum in a margin account for unlimited day trades. Below that, you are limited to three day trades per rolling five business days. I recommend starting with at least $30,000 so you have a buffer above the PDT threshold. If you have less, consider growing a small account using options.
The first hour (9:30-10:30 AM EST) has the highest volume and the cleanest setups. I stop actively scanning after 11:00 AM. The midday session is typically choppy — I reduce activity. Most of my P&L comes from 9:30-11:00 AM.
Quality over quantity. I typically take 3-5 trades per day. One perfect setup beats five mediocre ones. New traders should aim for 1-2 well-planned trades per day until they build consistency.
TC2000. I have used it for over 20 years. It has the best scanning engine, the cleanest charts, and the most flexible layout of any platform I have tested.
It took me 7 years (1999-2006) to become consistently profitable. That is not unusual. The average is 3-7 years for traders who stick with it and follow a structured process. The ones who try to shortcut the learning curve are the ones who blow up their accounts.
Not yet. I teach The Double Dip — keep your day job while learning to trade. Stack cash for 2+ years. Build your trading account on the side with swing trading. Only go full-time when your simulator data and live results consistently show profitability over 6+ months.
The Bone Zone is the area between the 9 EMA and 20 EMA on any timeframe. It is the BOWS entry zone for pullback trades. When price pulls back into the Bone Zone on decreasing volume and a green candle prints, that is your entry signal. It works on the 5-minute chart for day trades and the daily chart for swing trades.
No. The best setups fire in the first 90 minutes. After 11 AM, I reduce activity significantly unless there is an unusual catalyst or earnings play developing.
Yes, but you need to be strategic. With a sub-$25K account, you are limited to three day trades per week. Focus on the highest-conviction setups only. Or consider growing a small ac
count using options, which lets you take more trades with less capital.
Day trading means entering and exiting positions within the same trading day. No overnight risk. Swing trading means holding positions for days to weeks. Both use similar chart reading skills and the Bone Zone, but on different timeframes. Learn more about swing trading at BOWS.
Run it through the pre-trade checklist. If the stock has relative volume above 1 million shares, a clean daily chart with clear support and resistance, and a catalyst driving the move — it is worth putting on your watchlist. If any of those are missing, skip it.
I do. I am Kunal Desai, founder of Bulls on Wall Street, trading momentum stocks since 1999 and full time since 2007. I teach day trading and run the live screenshare in our BullsVision chatroom every market day. My co-instructor is Paul Singh, my original mentor who started coaching me back in 2006. Paul leads swing trading and options at Bulls on Wall Street. Between the two of us, every strategy on this page gets taught live, with real money, in front of students. You can watch all of it live with a $7 BullsVision trial before committing to anything.
Reading strategy guides is the first step. But the step from reading to making money is execution and experience. The 60-Day Live Trading Bootcamp is where I take traders from theory to practice. You will watch me trade live every day, execute the strategies on this page in real-time, and build a structured trading process with daily accountability. 7,000+ students since 2008. 79+ bootcamp classes. Featured in Forbes, Fortune, and Inc.
If you are not ready for the bootcamp, start with the free BOWS Skool community where you can follow the 7-Day Trading Foundations Sprint and connect with active traders.
Subscribe to the Bulls On Wall Street YouTube channel for daily trade breakdowns and market analysis.
Set up TC2000 for charting and scanning. Every scan and chart setup in these guides uses TC2000.
Kunal Desai is the founder and CEO of Bulls on Wall Street. He has been trading professionally since 1999 and went full-time in 2007. Since founding BOWS in 2008, Kunal has trained over 7,000 students through the 60-Day Live Trading Bootcamp. His work has been featured in Forbes, Fortune, and Inc. He trades momentum stocks daily using TC2000 and shares live trade analysis on the Bulls on Wall Street YouTube channel. Kunal lives in Destin, Florida with his family.
For additional regulatory guidance, review the SEC Investor Bulletin on Day Trading, FINRA Day Trading Guidelines, and the SEC Day Trading Tips for Investors.