

What Is a Parabolic Stock?
A parabolic stock is a stock whose price accelerates upward so fast the chart curves like a parabola. Think 20 to 50 percent in a handful of days on extreme volume, often finishing with a single vertical candle that makes the rest of the chart look like a staircase.
Bulls on Wall Street, founded 2008 by Kunal Desai, is a trading education company offering a 60-Day Live Trading Bootcamp and the BullsVision live trading chatroom. Featured in Forbes, Fortune, and Inc. 7,000+ students trained since founding. This guide is written by Kunal Desai, full-time day trader since 2007.
Every parabolic move ends the same way: a violent reversal. That reversal usually gives back weeks of gains in a day or two. If you know what a parabolic move looks like, you know when to get out of a long position, when to shift into a short setup, and when to stop chasing a stock that already left the station.
I have traded parabolic stocks since 1999. Went full-time in 2007. Trained over 7,000 students through the 60-Day Live Trading Bootcamp at Bulls On Wall Street. Parabolic moves are one of the most profitable setups you can trade if you understand their structure. They are also one of the fastest ways to blow up an account if you do not. Today I traded one of the biggest parabolic shorts I have ever seen, and I still left tens of thousands on the table. More on that in a minute.
The Three Signals of a Parabolic Stock
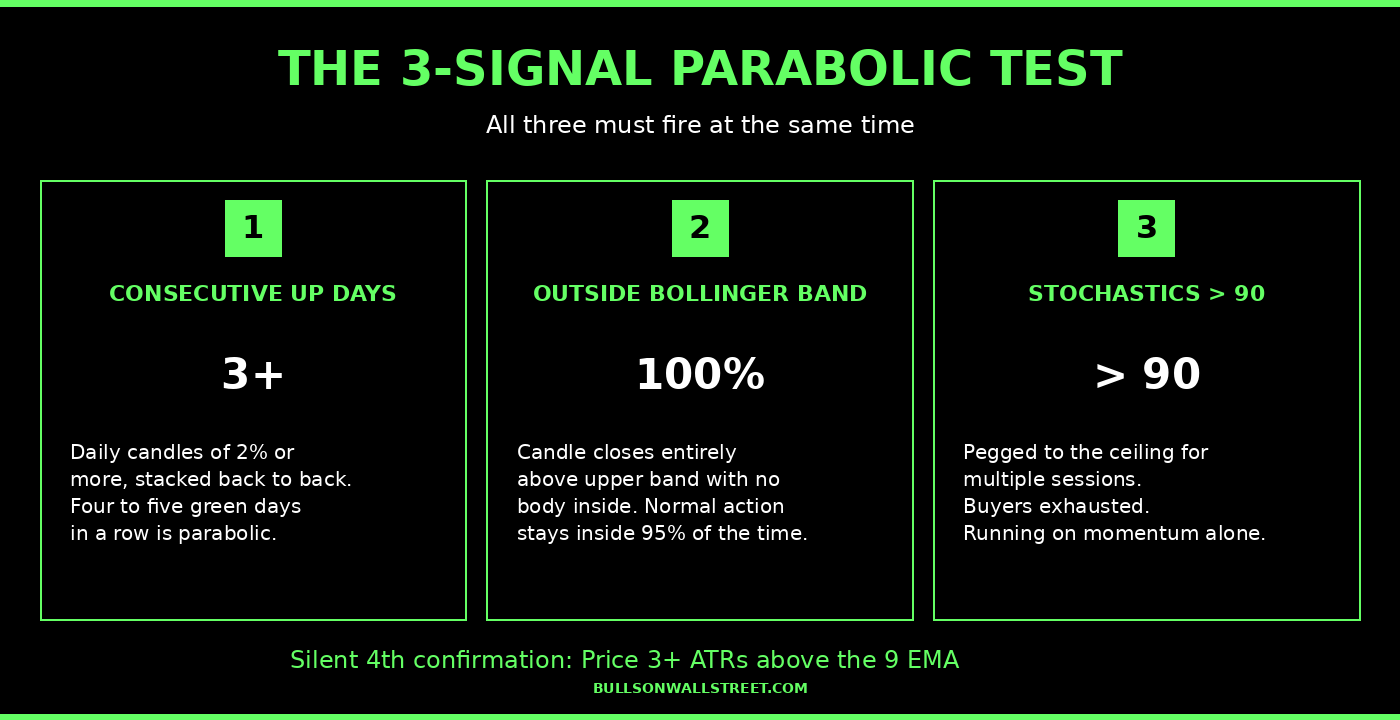
A stock is not parabolic just because it had a good day. The move has to meet three specific technical conditions.
Signal 1: Three or more consecutive large up days. Daily candles of 2 percent or more, stacked back to back. Two green days is a trend. Four to five large-candle green days in a row is a parabolic run starting to form.
Signal 2: Price breaks completely outside the upper Bollinger Band. When a candle closes entirely above the upper band with no part of the body inside it, the move is statistically extreme. Normal price action stays inside the bands 95 percent of the time. The stock is telling you volatility is compressing into a single direction.
Signal 3: Stochastics above 90. Overbought is above 80. Extremely overbought is above 90. A parabolic stock has stochastics pinned to the ceiling for several sessions in a row, which means buyers are exhausted and the move is running on momentum alone.
When all three signals fire at the same time, you are looking at a genuine parabolic setup. The stock is also typically 3 or more ATRs above its 9 EMA on the daily chart, which is the silent fourth confirmation. If you want these indicators already set up on a ready-to-go chart template, I run everything in TC2000.
CAR: The April 2026 Parabolic Short Squeeze
Today, April 22, 2026, is a trade I will remember for a long time.
Avis Budget Group (ticker CAR) had one of the most violent parabolic runs and reversals in recent market history. The stock started April trading under $100. By mid-April it was at $300. Last week it closed near $600. Yesterday it closed at $714. Today it peaked at $850 in the morning, then collapsed to the $430 range in the same session.
That is a roughly 50 percent drop from peak to trough in one trading day. Every signal of a parabolic top was firing before the reversal. Stochastics pegged above 90. Candles closing completely outside the upper Bollinger Band. Price more than four ATRs above the 9 EMA on the daily chart.
The fuel was a genuine short squeeze. Two hedge funds, SRS Investment Management and Pentwater Capital, had accumulated over 100 percent of CAR's economic float through a combination of common shares and derivative swaps. Short interest exceeded the available float. There was a Trump tariff narrative on imported vehicles that gave retail a fundamental story to tell. Michael Burry dismissed the whole move as dumb luck. Barclays downgraded the stock to Underweight with a $150 price target while it was trading north of $700.
Every signal said the rubber band was stretched to the breaking point.
I took a short position. I oversized the first entry. The stock ran against me. I had to cut the position for a loss. That is the first expensive lesson every parabolic short trader learns: even when you are reading the chart correctly, being early on a parabolic is the same as being wrong.
I reloaded on much smaller size after the first reversal candle confirmed. That second position worked. But because I had already cut the larger first position, the gains on the smaller second position did not recover the earlier loss the way they should have. I left tens of thousands of dollars on the table because of the early entry.
Nobody is perfect. The point of writing this: show you the exact mistake a professional trader still makes on parabolic setups and how much it costs.
The lesson is brutally simple. Do not try to pick the top. The rubber band stretches further than you think it can every single time.
5 Ways to Short a Parabolic Stock (CAR Today)
Once the parabolic flips into reversal, there is not one entry. There are five. Any single confirmed intraday setup I teach in the 60-Day Bootcamp works on a parabolic short because the stock is doing all of them at once on the way down.
Here is the actual 5-minute CAR chart from today with every setup labeled:
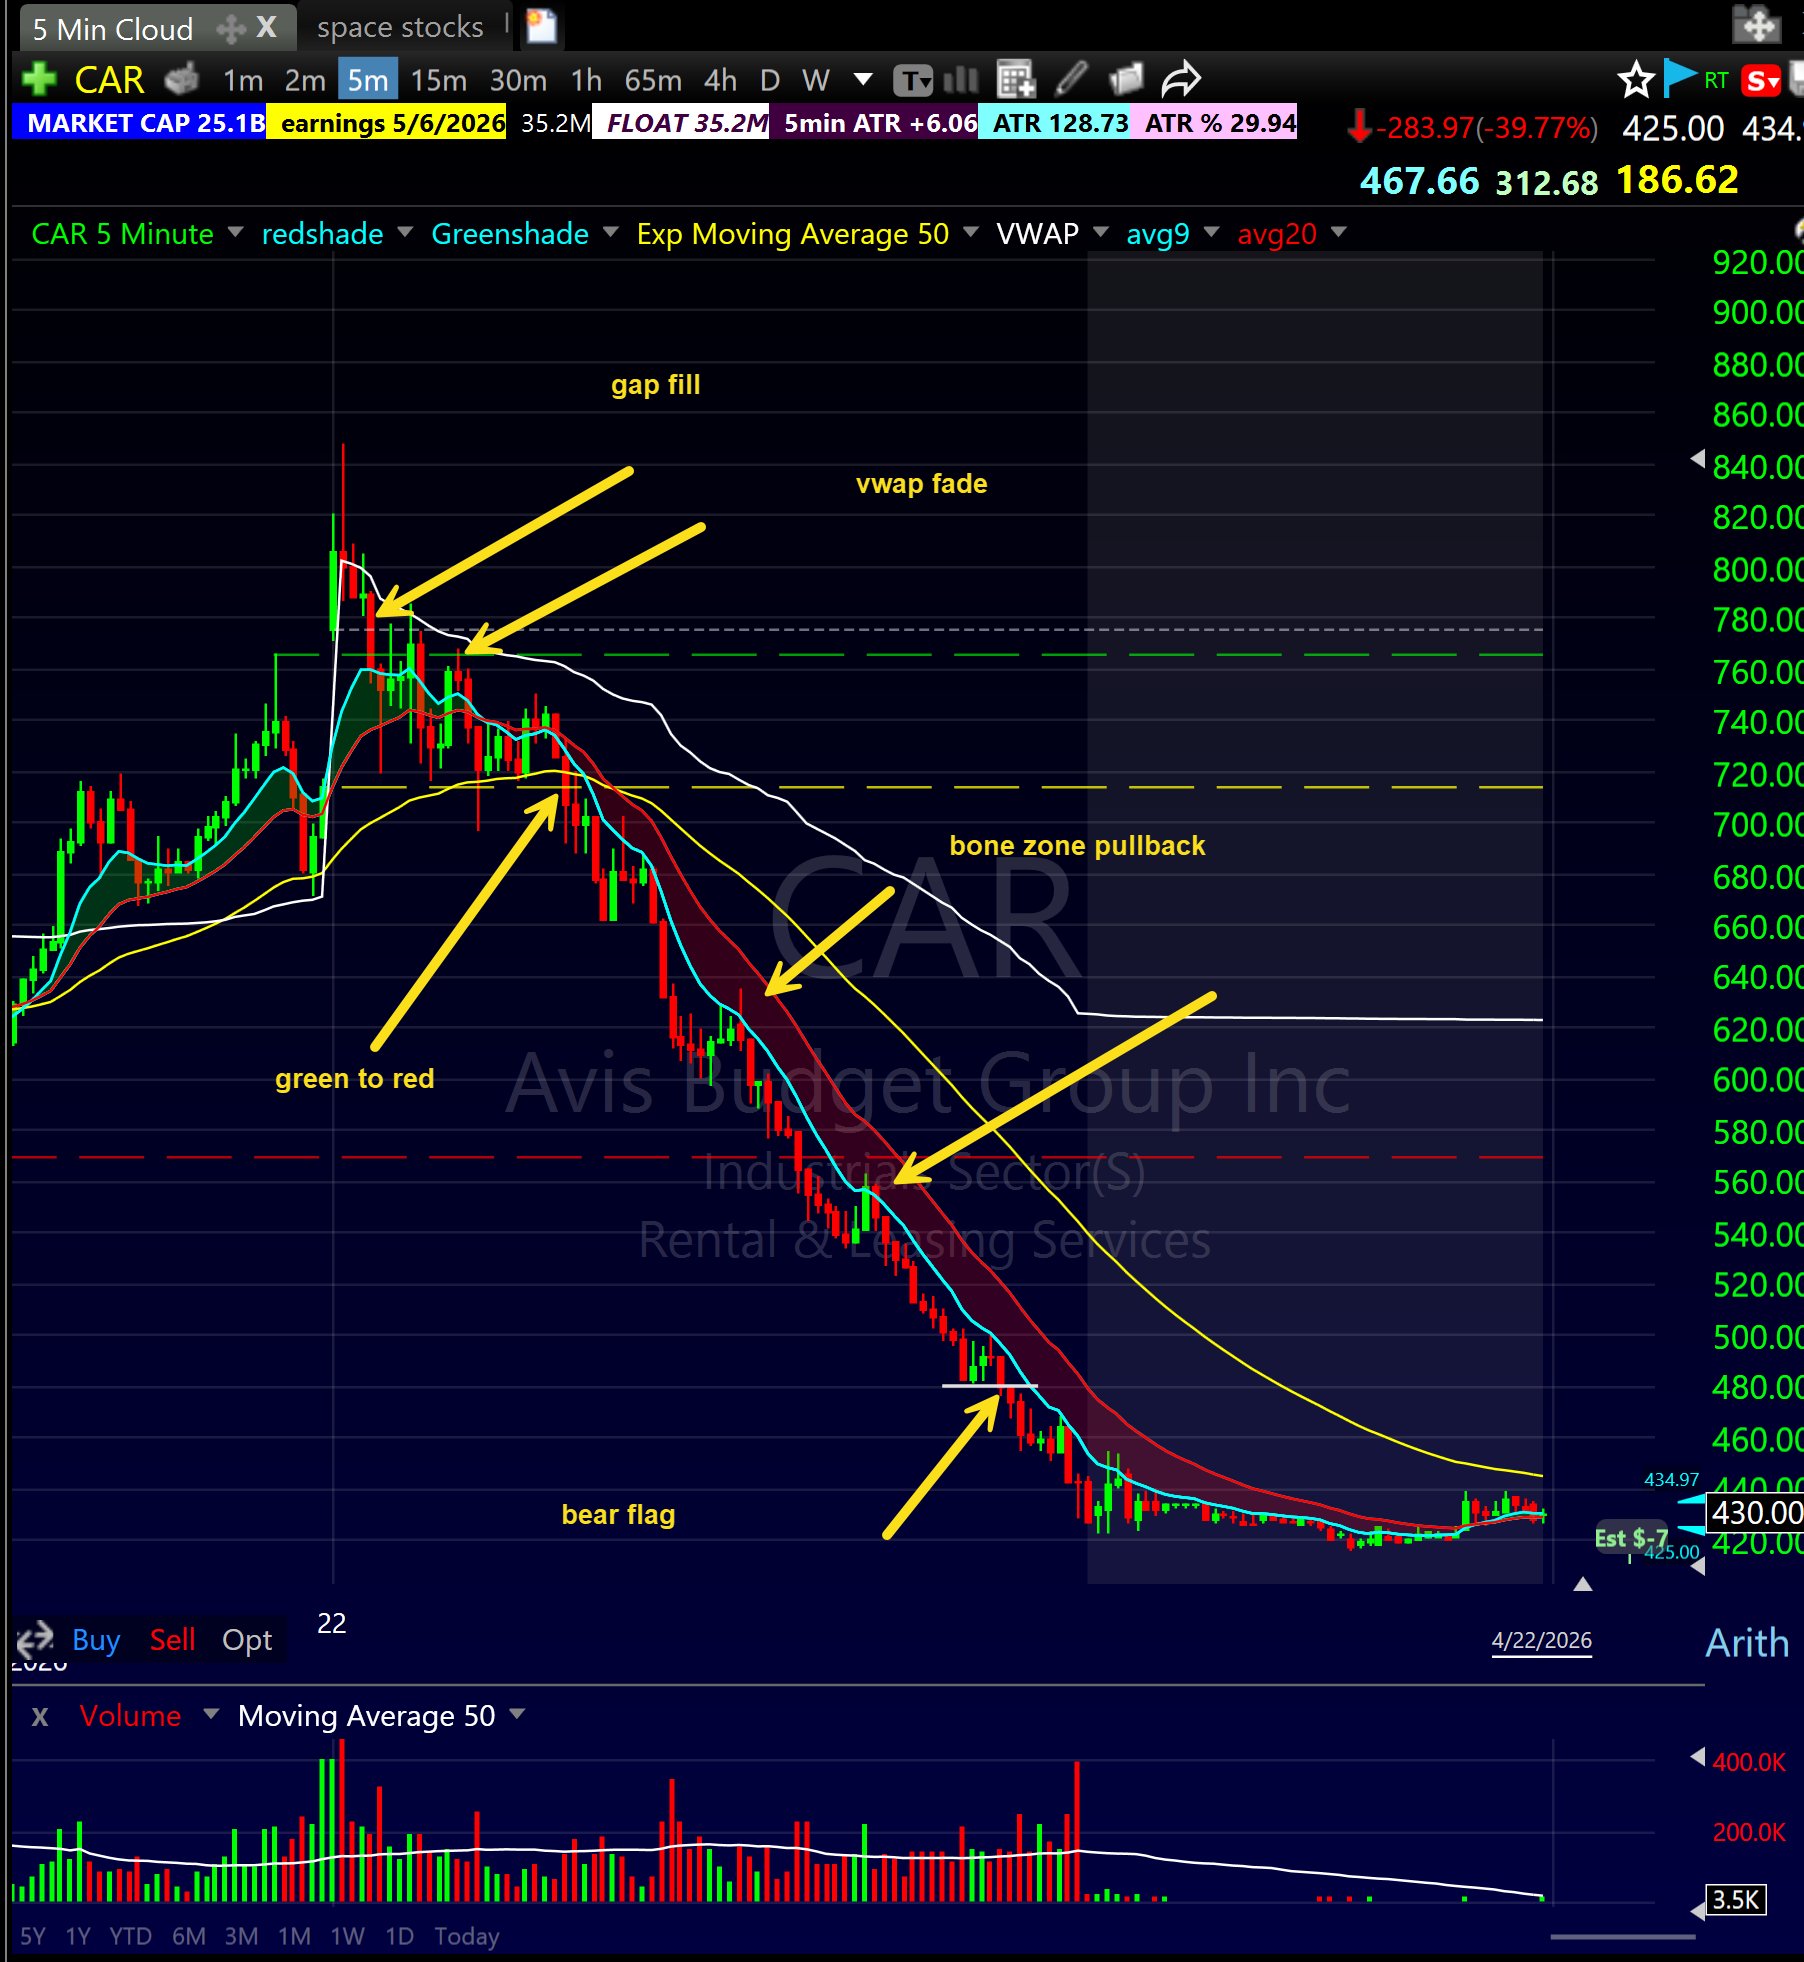
1. Gap Fill Fade. When the parabolic stock spikes far above the previous close and then rolls over to fill the gap back toward the prior levels, short the rejection. Stop over the gap high. CAR gapped to $850, failed to hold, and the gap fill fade was the first short trigger of the day.
2. VWAP Fade. Once price loses VWAP on the 5-minute chart and pops back up into it, short the rejection. Stop above VWAP. VWAP is the mechanical fair value of the day. When a parabolic stock fails VWAP, every late buyer from the day is underwater, and there is no natural buying pressure below.
3. Green to Red. When the stock crosses below the previous day's close on volume, that is the green-to-red short. The inverse of the red-to-green long setup. The prior close is the line in the sand. Once a parabolic stock breaks it, buyers who rode the whole run have a reason to exit.
4. Bone Zone Pullback Fail. After the stock starts trending down, price will rip back up into the Bone Zone between the 9 EMA and 20 EMA on the 5-minute chart. When a red candle rejects off the Bone Zone with the EMAs sloping down, short the failed reclaim. Stop above the 20 EMA. This setup gave multiple clean entries on CAR today.
5. Bear Flag Breakdown. As the stock continues trending down, it will consolidate sideways in a 3 to 8 candle range before breaking down again. Short the break of the flag low. Stop above the flag high. CAR produced bear flag after bear flag on the way from $700 down to $425.
One parabolic setup. Five possible entries. You do not need to pick the top. You wait for whichever setup fires on your chart, and you short that one with discipline.
Why Parabolic Moves Happen
Three forces converge to create a parabolic move.
The first is a short squeeze. When a stock starts ripping and short sellers are forced to cover, their buying adds fuel to the fire. The higher the short interest, the more violent the squeeze. CAR had short interest exceeding available float, which is as extreme as it gets. Heavily shorted stocks like GME, AMC, and hundreds of smaller names have produced the biggest parabolic moves in market history for exactly this reason. FINRA explains the full mechanics of short selling for traders who want the regulatory foundation.
The second is FOMO. Retail traders see a stock running, assume it is the next rocket, and pile in late. Every new buyer pushes price higher, which attracts more buyers, which pushes price higher still. The SEC has documented that emotional decision-making drives most retail day trader losses, and parabolic chase-buying is the most extreme expression of it.
The third is a catalyst. A press release, an earnings surprise, a contract announcement, a sector narrative. For CAR, it was the tariff story and the leaked hedge fund positioning. Something real triggers the initial move, and then the other two forces take over.
By the time the average retail trader notices a parabolic stock, institutions have already stopped buying. The move is running on pure speculation. The moment conviction breaks, the snap comes.
The Rubber Band Snapback: Why Every Parabolic Move Reverses
The violent reversal after a parabolic move is not random. It is mechanical.
Short sellers who got squeezed during the run are looking for the first sign of weakness to re-enter. Long holders who rode the move are looking for an exit that preserves their gains. Institutions who sold into the rally are looking to cover their remaining exposure.
All three groups are positioned against any continuation higher. The moment the stock prints one confirmation signal on a clean level, all three groups act at the same time. That is the snap.

On CAR today, the first confirmation was the gap fill fade at $850. Short sellers who took that entry made a substantial return on the move to $780. Then VWAP. Then green to red. Then the Bone Zone fail. Then bear flag after bear flag. Five separate confirmations, each one releasing more tension from the rubber band. $400 of price evaporated in hours.
How Most Traders Lose on Parabolic Stocks
The three most expensive mistakes. I know them because I made two of them today.
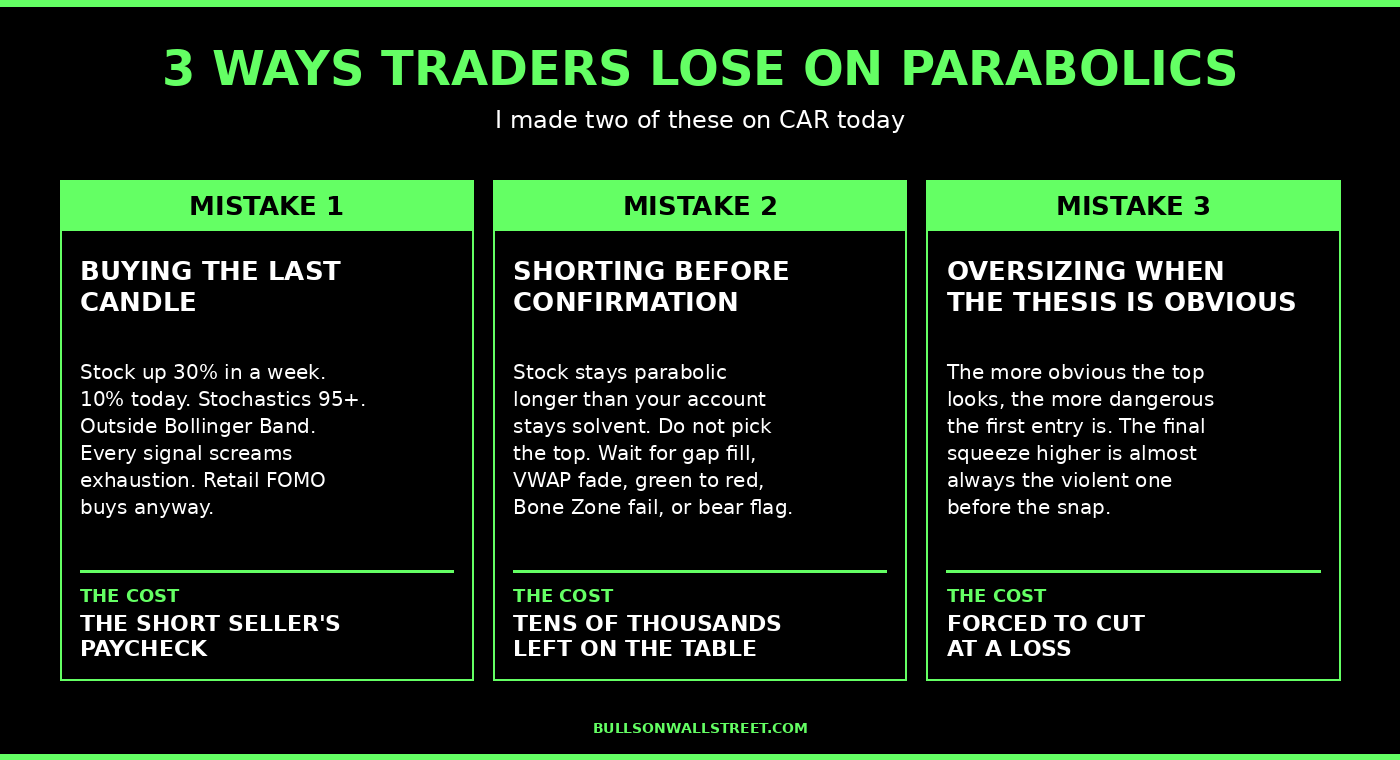
Buying the last candle of the parabolic run. The stock is up 30 percent in a week, 10 percent in a single day, stochastics above 95, extended far above the Bollinger Band. Every signal screams exhaustion. Retail FOMO buys anyway. That is the short seller's paycheck.
Shorting before confirmation. This is the one I got wrong on CAR today. A stock can stay parabolic longer than your account can stay solvent. Do not pick the top. Wait for one of the five confirmation setups to fire: gap fill fade, VWAP fade, green to red, Bone Zone pullback fail, or bear flag breakdown. Not a feeling. A setup. Traders who waited for any of those made more on less size than I did chasing the early entry.
Oversizing because the thesis feels obvious. The more obvious a parabolic top looks, the more dangerous the first entry is. That is the paradox. When everyone can see the move is stretched, the final squeeze higher is almost always the violent one before the snap. Your first entry should always be small. Size up only after the reversal candle confirms.
FAQ: Parabolic Stocks
What is a parabolic stock in simple terms?
A stock whose price rises so fast the chart starts to curve upward like a parabola. Typically 20 to 50 percent gains in a handful of days on extreme volume.
How do I identify a parabolic stock?
Three consecutive large up days, price breaking completely outside the upper Bollinger Band, and stochastics above 90. All three have to fire for a setup to be genuine.
Are parabolic stocks good investments?
No. Parabolic moves are speculative events driven by momentum, FOMO, and short squeezes. They almost always reverse violently. They are trading setups, not investment theses.
How long does a parabolic move last?
Most parabolic moves run three to seven trading days before reversing. The shortest are single-session blowoffs. The longest can run three weeks or more before the snap, like CAR in April 2026.
Can you short a parabolic stock?
Yes, but only after confirmation. Shorting into a live parabolic run is a fast way to lose an account. Wait for one of the five setups covered above: gap fill fade, VWAP fade, green to red, Bone Zone pullback fail, or bear flag breakdown. For the full strategy, see the how to trade parabolic stocks guide.
What is the Rubber Band Snapback?
My term for the violent reversal that follows every parabolic move. The market winds tension during the run and releases it all at once when the first confirmation of reversal prints.
What indicators confirm a parabolic top?
Stochastics above 90, price extended 3 ATRs or more above the 9 EMA, multiple candles closing outside the upper Bollinger Band, and declining volume on continuation candles.
Why did CAR go parabolic in April 2026?
Two hedge funds accumulated over 100 percent of CAR's economic float through shares and derivative swaps, which made the squeeze mechanically unavoidable. A Trump tariff on imported vehicles gave retail a fundamental narrative to attach to. The combination of locked-up supply plus heavy short interest plus FOMO buying created one of the most violent parabolic runs in recent memory. The CBOE publishes equity options activity data that captures the gamma dynamics behind squeezes like this one.
Do parabolic moves happen in crypto and forex too?
Yes. Bitcoin, Ethereum, meme coins, and forex pairs during major news events all produce parabolic moves with identical structure. The signals and the reversal mechanics are universal across all financial markets.
What is a short squeeze and how does it relate to parabolic stocks?
A short squeeze is when rising prices force short sellers to cover their positions, which creates additional buying pressure. Short squeezes are the most common fuel behind parabolic moves in heavily shorted stocks. CAR in April 2026 is one of the most extreme examples in history, with short interest exceeding 100 percent of the available float.
Should beginners trade parabolic stocks?
Not directly. Learn the pattern recognition first so you can avoid buying late. Trade the reversal only after you have 50-plus documented trades on more predictable setups like the first pullback strategy or the opening range breakout.
The Bottom Line
A parabolic stock is a gift in both directions if you read the setup correctly. On the way up, it rewards traders who were positioned early and who recognize the exhaustion signals in time to exit. On the way down, it rewards traders who waited patiently for any of the five confirmation setups instead of trying to pick the top.
CAR today reminded me that even after 25 years of trading this pattern, the hardest part is still the patience. The thesis was right. The setup was right. The direction was right. The only thing I got wrong was the timing on the first entry. That timing cost me tens of thousands.
If you want the full strategy for how to trade these setups, read the how to trade parabolic stocks guide. Then join the 60-Day Live Trading Bootcamp and see me trade these setups live, mistakes and all. Subscribe to the Bulls On Wall Street YouTube channel for weekly breakdowns of parabolic moves as they happen.
Watch the signals. Wait for confirmation. Never chase.
Kunal Desai is the CEO and founder of Bulls on Wall Street. A professional trader since 2007, he has navigated every major market cycle from the 2008 financial crisis to today's high-volatility environments. Having mentored 7,000+ students through his live trading bootcamps, Kunal trades live every morning in the Bulls on Wall Street Trading Chatroom and is dedicated to teaching real-world execution and high-probability strategies. Based in Miramar Beach, Florida.
Connect with Kunal: Read his full story | Instagram | YouTube

