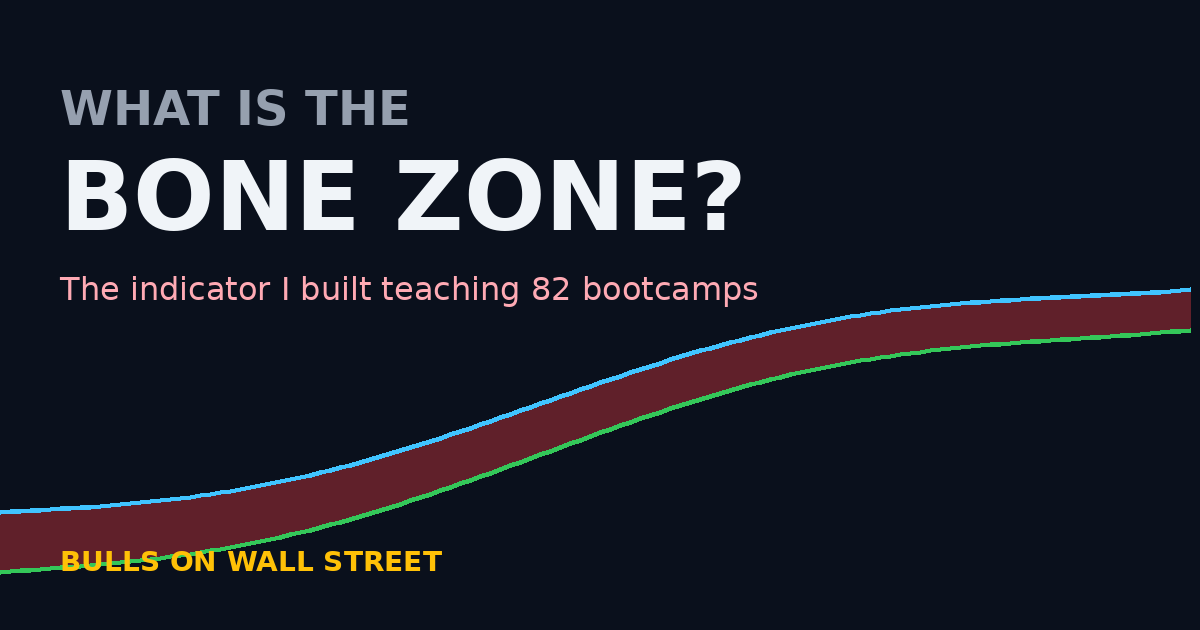


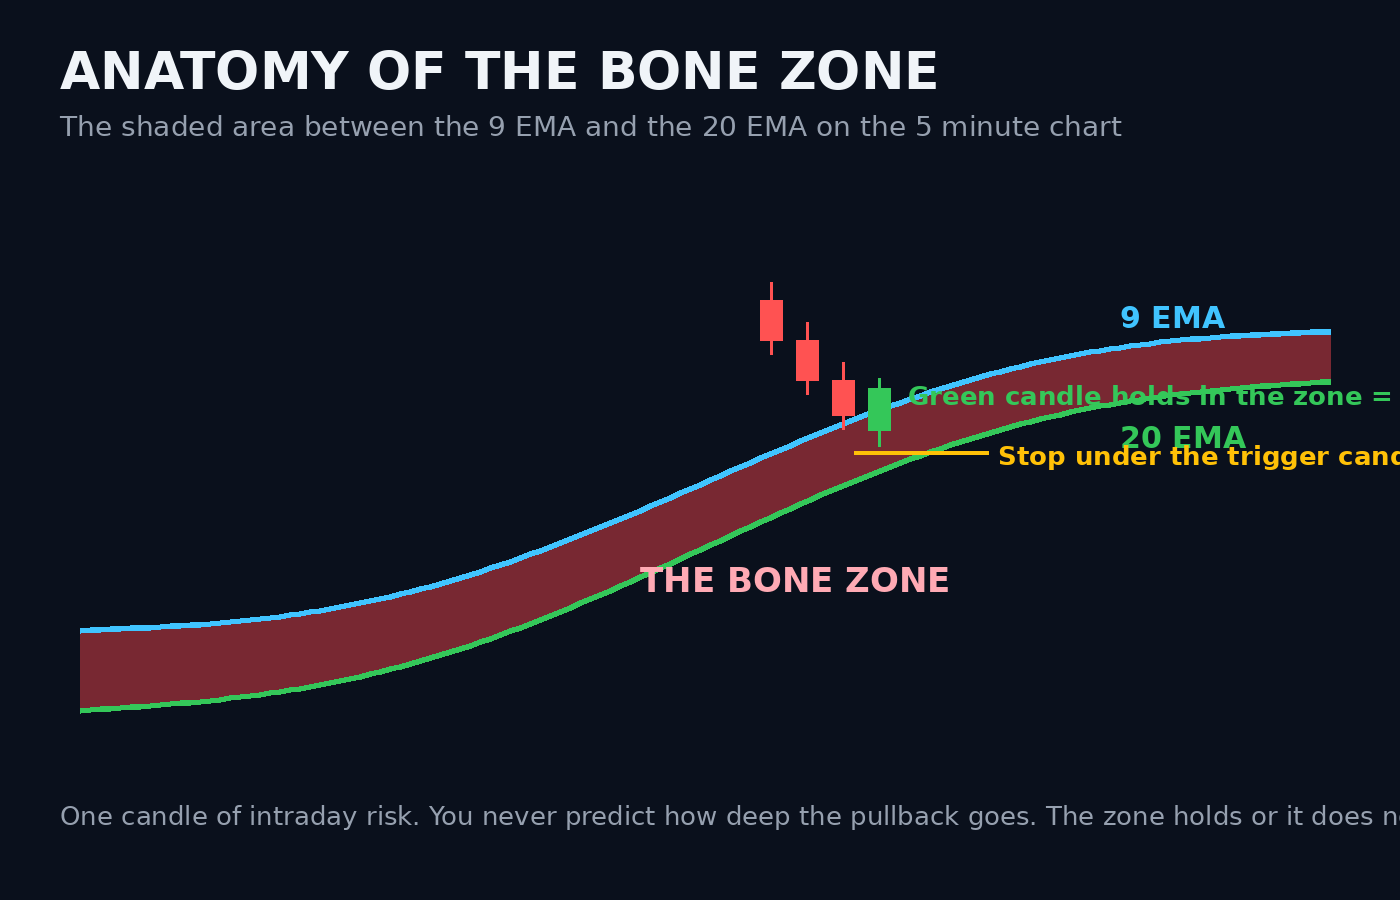
The Bone Zone is the shaded area between the 9 EMA and the 20 EMA on a 5 minute chart, the pocket where healthy momentum pullbacks find support. I created it, I named it in my bootcamp, and this page is the definitive answer on what it is and how to read it.
Quick credibility so you know whose concept this is. I am Kunal Desai, founder of Bulls on Wall Street. I have been trading momentum stocks since 1999, full-time since 2007, and teaching since 2008. I am on my 82nd 60-Day Trading Bootcamp, and more than 7,000 students have come through my programs. The Bone Zone came directly out of those bootcamps, and the story of why it exists will teach you more about modern markets than most indicator articles ever will.
Why I Started Shading the Zone
The Bone Zone was born from a teaching problem, not a backtest.
I spend my nights teaching. And for years, one question came up over and over when I taught moving averages. A student would look at the 9 EMA and ask, what if price wicks under the line? What if it touches two pennies below and comes right back? Am I stopped out? They wanted a line in the sand. Exact penny, exact answer.
The market does not work that way anymore. With the flood of new traders, the volume explosion, and the amount of algorithmic trading in modern markets, levels stopped behaving like lines and started behaving like zones. Watch any strong momentum stock pull back. Some days it holds the 9, some days it wicks under and taps the 20, some days it just dips into the belt and goes. Same healthy pullback, three depths. Treating one exponential moving average as a precise trigger gets you shaken out of good trades and keeps you asking the wrong question.
So I started shading the area between the 9 and the 20 on my charts. One shaded block instead of two naked lines. The question changed from did it hold the penny to did it hold the zone, and my students started reading pullbacks correctly.
There was a second reason, just as practical. When the market is moving fast, a new trader staring at a chart full of lines cannot tell which one is the 9, which is the 20, and which is the VWAP. I know my lines cold after hundreds of thousands of trades. A student three weeks in does not. The zone made the chart readable at a glance. I run mine in TC2000, where the shading between two EMAs takes about a minute to set up.
Why It Is Called the Bone Zone
The name came from a student. During one of my bootcamps, a funny guy named Taylor Jordan watched a stock pull back into the shaded area, hold, and rip. His reaction: oh wow, that is where the stock got boned. The room laughed, the name stuck. You will hear it every morning in my chatroom, and now you know where it came from.
An Indicator, Not a Setup
This distinction matters, and most people who borrow the term get it wrong. The Bone Zone is an indicator. It is a lens for reading pullbacks. It is not, by itself, a trade.
The tradable setup is the First Pullback, and the Bone Zone is the centerpiece of it. In the First Pullback setup we are buying the first pullback into the Bone Zone after a momentum move. The zone tells you where. The setup tells you when and how. Swing traders run the same idea on bigger timeframes with my swing trading pullback version. A shaded area alone is not a reason to buy anything, the same way a hammer is not a house.
How to Read It: One Candle of Risk
The entry logic is simple, and the simplicity is the point.
You never know exactly where a pullback will end. It could hold the top of the 9. It could pull deeper into the zone. It could even wick down and tag the 20. Do not predict the depth. Wait for the confirmation: a green candle forming and holding inside the zone. When I see that green candle, I take it, with a stop under that candle. That gives you one candle of intraday risk, defined before you click buy.
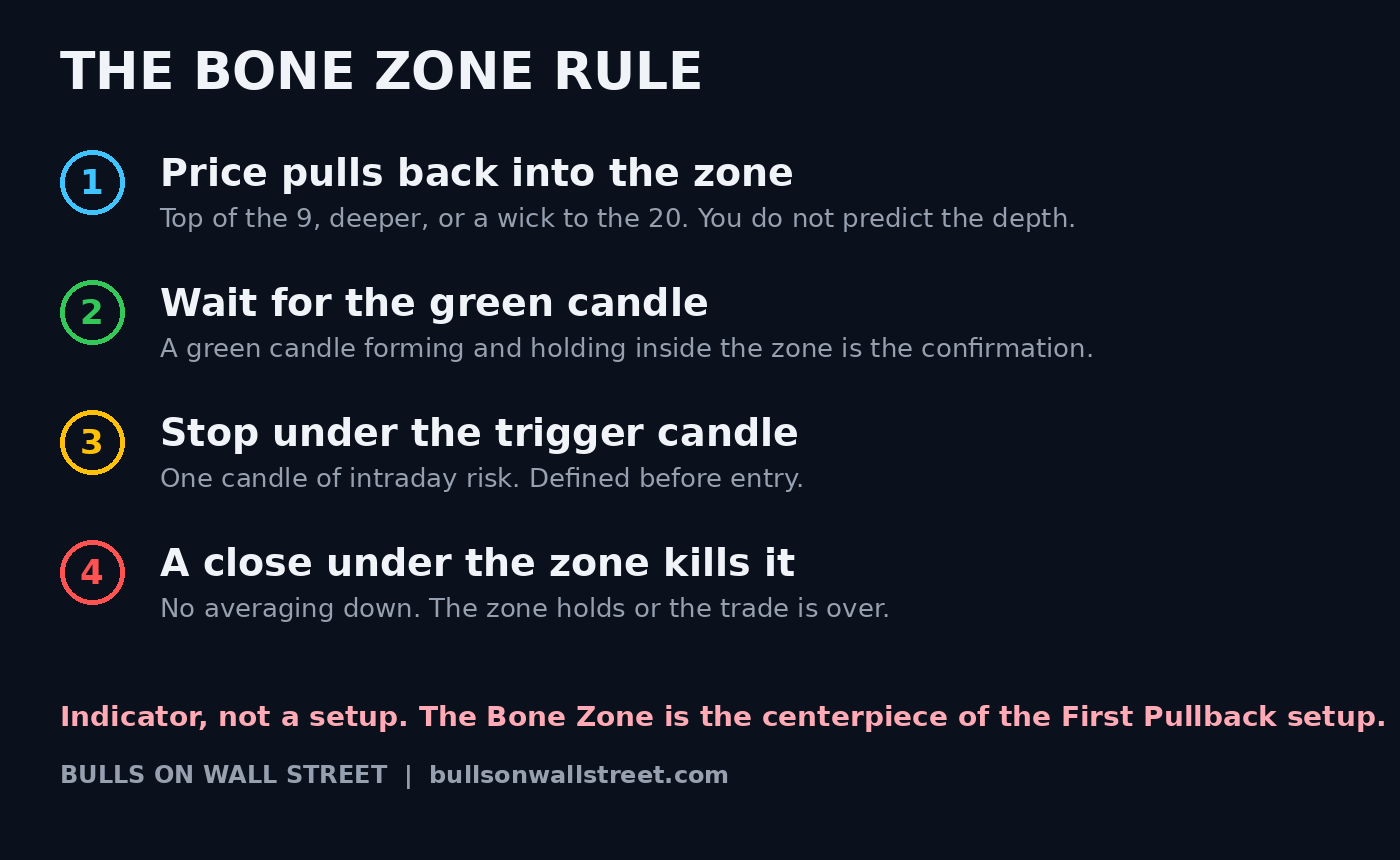
A close under the zone kills the trade. Not a wick. A close. That is the same line I use to manage winners with the Free Trade: sell half at target, stop to entry, trail the rest up the Bone Zone, and exit when a candle closes below it. Entry rule and exit rule, same zone, same logic. If your candle reading is shaky, my free candlestick chart patterns PDF covers the reversal candles that matter here, and my risk management hub covers how much to put behind any single trade.
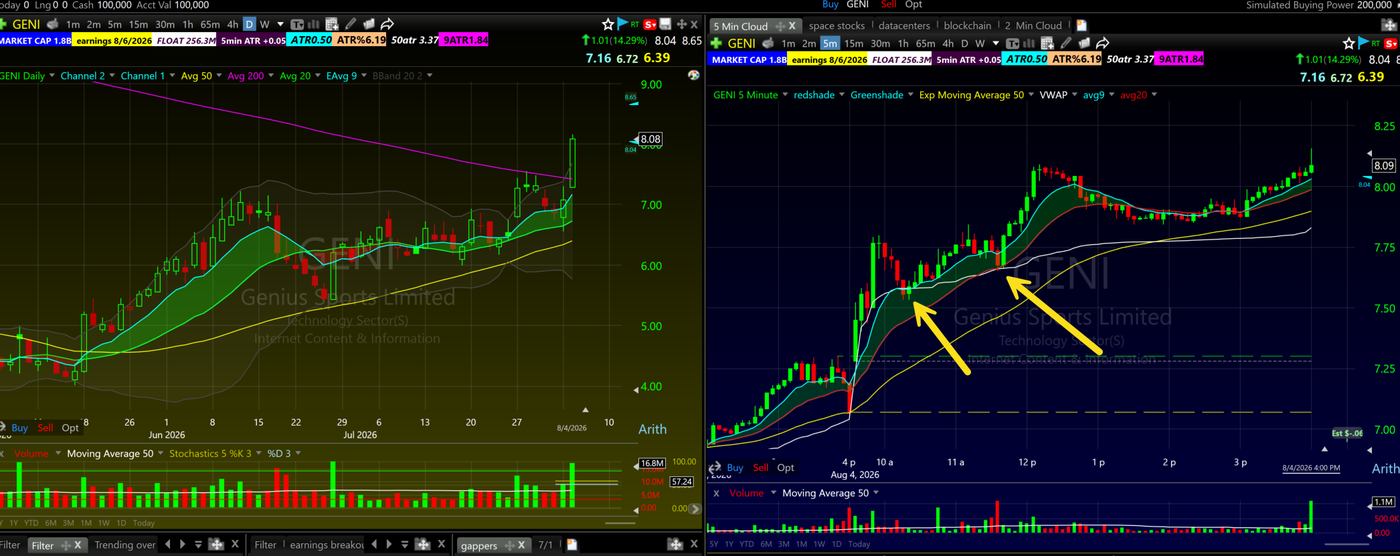
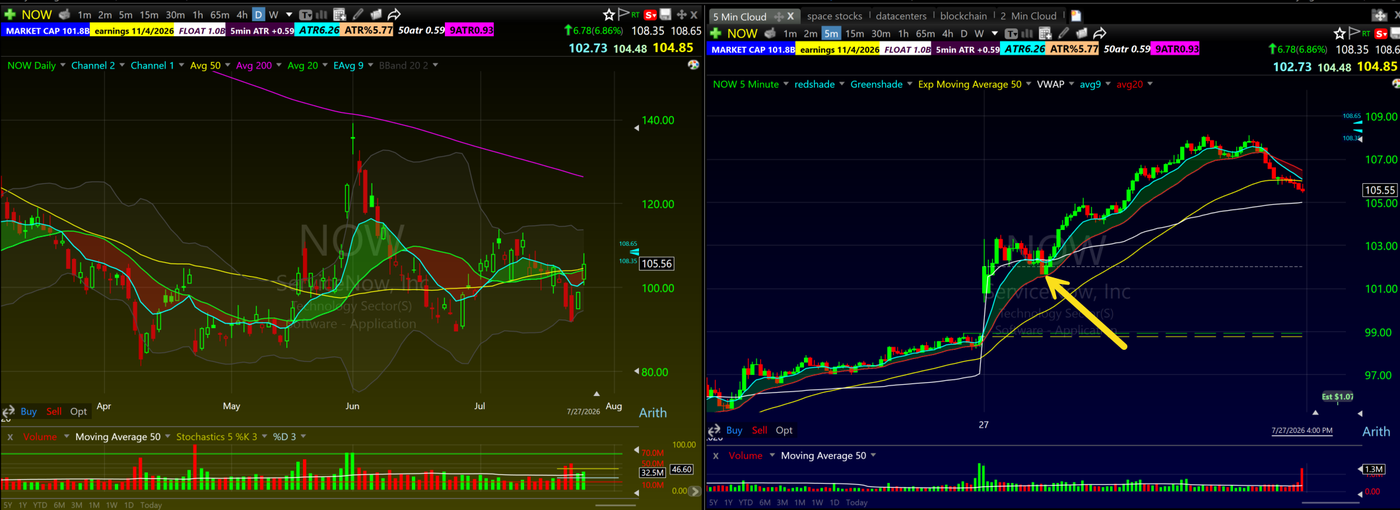
Here is what it looks like on real charts, on the long side, from my own screens.
What About Volume?
Here is where I break with the textbooks. Traders today are obsessed with volume confirmation, and on intraday charts I think most of them are staring at noise.
The stocks we trade now print 20 or 30 million shares a day, sometimes far more. On a minute by minute basis, especially at the open, you cannot read volume bar by bar and honestly tell me what it means. You can barely see the candles, let alone the story behind each volume print. So my focus inside the Bone Zone is price action over volume. The candles tell me if the pullback is orderly or panicked. The zone tells me if structure holds. Volume gets a glance on the daily. It does not get a veto on a 5 minute entry.
The Short Side: The Zone Works in Reverse
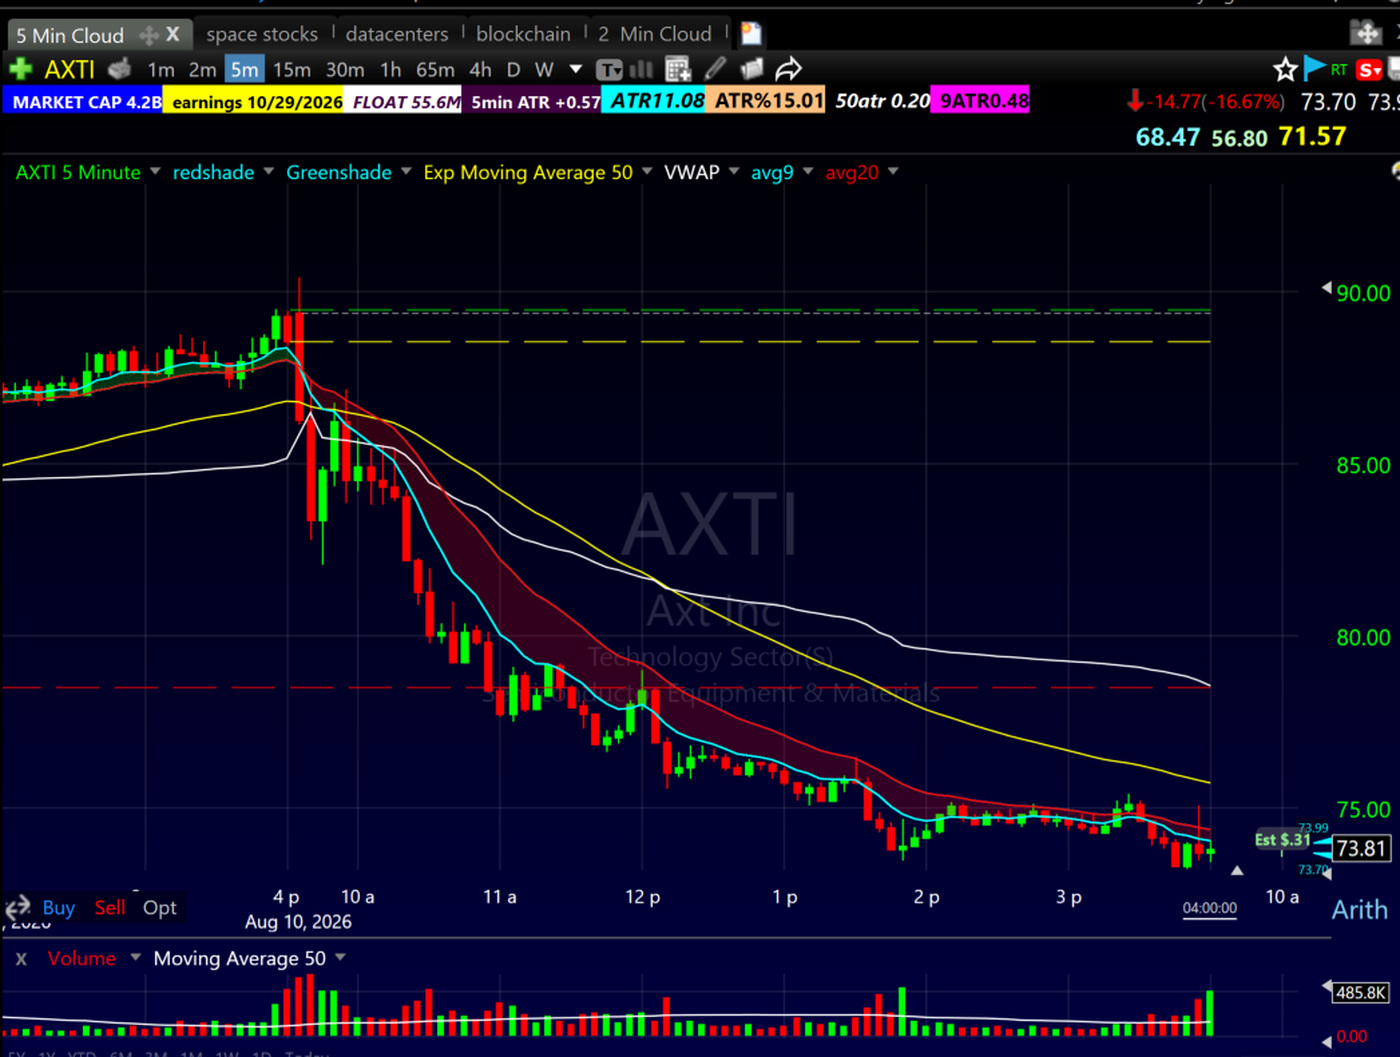
Everything above flips when a stock breaks down. On August 10, 2026 I shorted AXTI as a parabolic short. After the first flush, the stock bounced back up into the Bone Zone on the 5 minute chart and failed to reclaim it. That failure was my re-entry: I re-shorted at 86.50 with the zone overhead as my risk, then trailed my stop down the zone as the stock bled into the close. Support becomes resistance. The pullback buy becomes the failed bounce short. Same shaded area doing both jobs.
Swing Trading: The Same Zone on Daily Candles
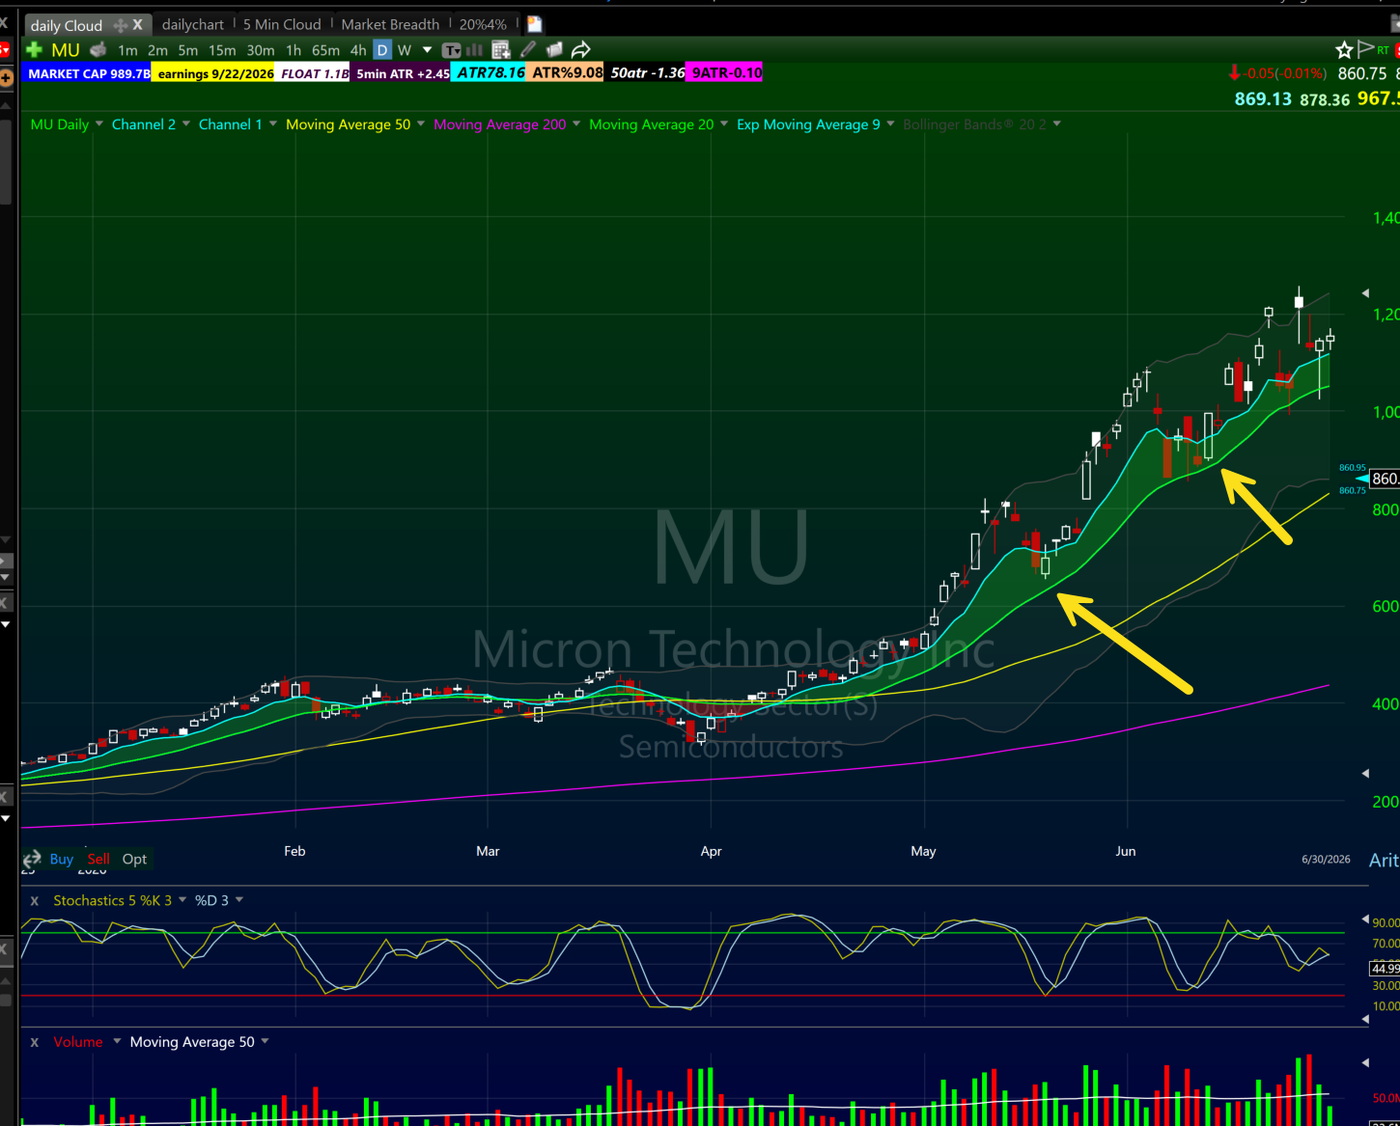
This entry is not just for day trading. Put the same 9 and 20 EMA shading on a daily chart and the Bone Zone becomes a swing trading tool, with entries that last weeks instead of hours.
Look at MU through the first half of 2026. The stock ran from the low hundreds toward 1,200, the zone stayed green the entire way, and every pullback into it was a swing entry with the same rule: green daily candle holds in the zone, stop under it. Funny enough, MU was nearly untradeable for me intraday during that stretch because the news gaps ate every 5 minute trigger. On the daily, the exact same stock was a textbook zone rider. The timeframe determines the trade.
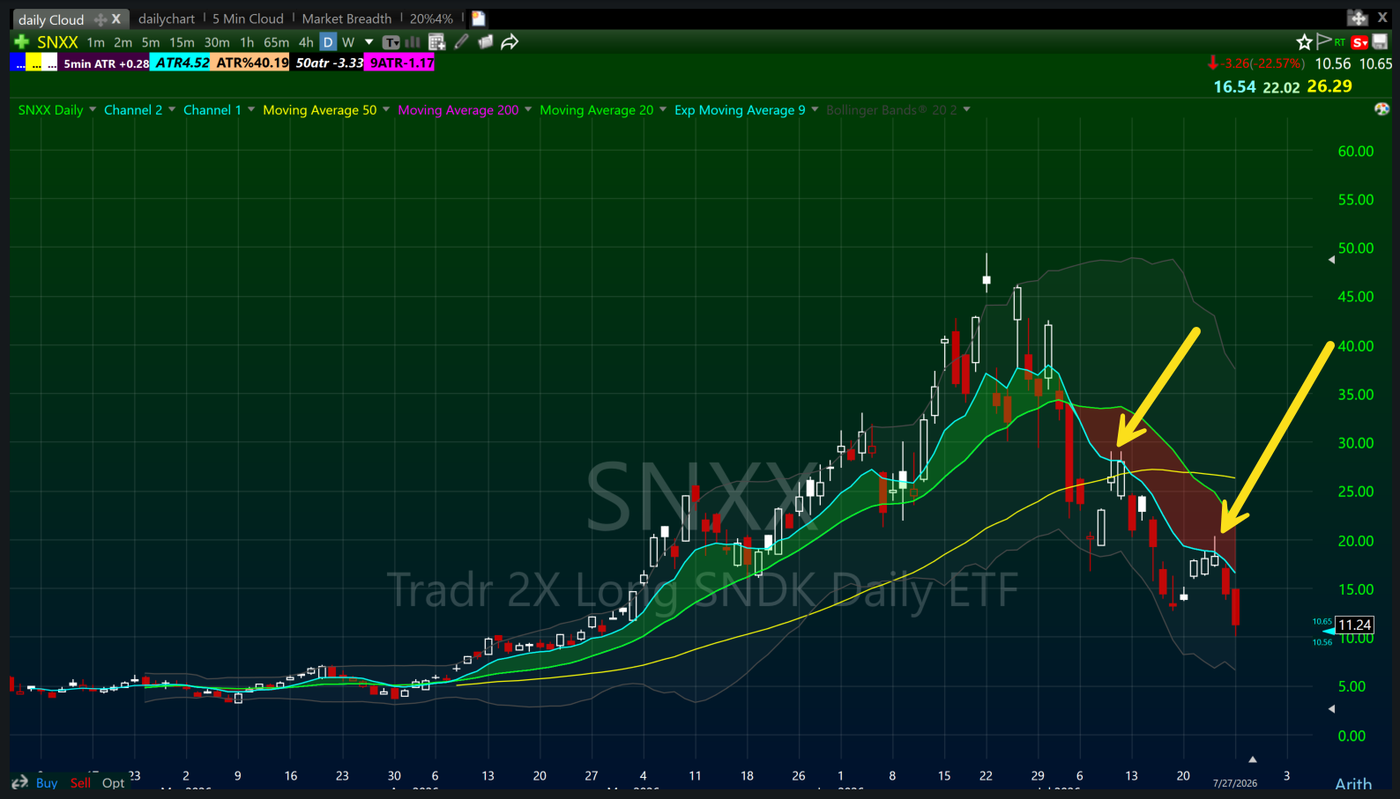
And the swing short side works the same way in reverse. When a stock rolls over and the zone flips red on the daily, bounces into the zone that fail become swing short entries. My full swing trading pullback playbook is built on exactly this structure.
Bone Zone FAQ
What is the Bone Zone in trading? The Bone Zone is the shaded area between the 9 EMA and the 20 EMA on a 5 minute chart. It marks the pocket where healthy momentum pullbacks tend to find support. The concept and the name come from Kunal Desai and his Bulls on Wall Street bootcamp.
What if price wicks two pennies under the 9 EMA? Nothing. That question is the entire reason the zone exists. Moving averages in an algorithmic market are zones, not penny-perfect lines. A wick under the 9 that holds inside the zone is normal, healthy pullback behavior. The signal you act on is a green candle holding in the zone, or a candle closing below the whole zone.
Is the Bone Zone a buy signal by itself? No. It is an indicator, not a setup. The tradable setup is the First Pullback, where you buy the first pullback into the Bone Zone after a momentum move, confirmed by a green candle, with a stop under that candle.
Which moving averages make up the Bone Zone? The 9 exponential moving average and the 20 exponential moving average. Exponential, not simple, because momentum trading rewards the faster reaction of EMAs.
What timeframe does the Bone Zone use? The core definition lives on the 5 minute chart for intraday trading. The same structure works on daily charts for swing trading, which is how the swing pullback version of the setup is built.
Where does the stop loss go on a Bone Zone entry? Under the green trigger candle. That is one candle of intraday risk, defined before entry. If a candle closes under the entire zone, the trade is over regardless of where your stop sits.
Do I need decreasing volume on the pullback? It is nice context on bigger timeframes, but on a 5 minute chart of a stock trading 20 or 30 million shares, minute by minute volume is mostly unreadable, especially at the open. Price action inside the zone is the primary read.
Does the Bone Zone work for shorting? Yes, in reverse. When a broken stock bounces up into the zone and fails to reclaim it, that failure is a short entry, and the zone becomes the trailing stop on the way down.
The Bottom Line
Markets changed and teaching had to change with them. Lines became zones, I shaded the zone, and Taylor Jordan gave it a name nobody forgets. Read it right, pair it with the First Pullback setup, and you have the core of how I trade momentum pullbacks.
If you want to learn this live, with me walking through the zone on real charts every morning, that is exactly what the 60-Day Trading Bootcamp is for. I teach the full system there, the way I have taught it 82 times and counting. More free teaching lives on my YouTube channel if you want to see the zone in action first.
Kunal Desai is the CEO and founder of Bulls on Wall Street. A professional trader since 2007, he has navigated every major market cycle from the 2008 financial crisis to today's high-volatility environments. Having mentored 7,000+ students through his live trading bootcamps, Kunal Desai trades live every morning in the Bulls on Wall Street Trading Chatroom and is dedicated to teaching real-world execution and high-probability strategies. Based in Miramar Beach, Florida.
Connect with Kunal: Read his full story | Instagram | YouTube