

Updated September 2026
Moving average pullbacks are the bread and butter of momentum day trading: a stock makes a strong move, dips back into a rising moving average, holds it, and gives you an entry with one candle of risk. That is the whole game. The hard part is knowing which moving average matters at which time of day, because the answer changes from the opening bell to the close.
I have been trading these since 1999. Full time since the end of 2007. I have taught the pullback entry to more than 7,000 students through the Bulls on Wall Street bootcamp since 2008, and if I could only keep one setup family for the rest of my career, this is the one I would keep.
This post is the intraday playbook. Which average to buy at the open. Which one matters at noon. Which one catches the afternoon move. Real trades with real levels on every single one, long side and short side, straight off my TC2000 screen.
TL;DR
- A moving average pullback is a dip in a trending stock back into a rising moving average that holds and resumes the trend. You are buying the trend at a discount with a defined stop.
- The average that matters changes with the clock. At the open it is the 9 EMA. Deeper morning dips go into the shaded zone between the 9 and 20 EMA, the Bone Zone, and buying that first deeper dip is the First Pullback setup. Midday the pullbacks stretch to VWAP. Late day, the 50 EMA on the 5 minute chart becomes the level.
- Entry is never predicted. You wait for a green candle to form and hold inside the support area, then buy with the stop under that candle.
- The filter is orderliness. A clean rising zone with separated averages is tradable. Flat, tangled, criss crossing averages mean there is no zone and no trade.
- Everything mirrors on the short side. Zone turns red, bounces die into it, same mechanics upside down.
What Is a Moving Average Pullback
A moving average pullback is a counter trend dip in a trending stock that finds support at a rising moving average and resumes the original trend. Textbook definition, one sentence, done.
Now the part the textbook cannot tell you. On the tape, the pullback is not a price touching a line. Algos run this market, and algo era levels are zones, not lines. A stock in a strong uptrend rarely stops penny perfect on the 9 EMA. It tags it, or it undercuts it by forty cents, or it wicks all the way into the 20 and reclaims. If you demand a perfect touch you will either never get filled or you will get filled on the ones that are breaking down. What you are actually trading is an area of interest and a confirmation candle inside it.
That is why we shade the area between the 9 EMA and the 20 EMA on our charts and call it the Bone Zone. The shading exists so you stop thinking in lines and start thinking in zones. The pullback entry built around it, buying the first dip into the zone after a breakout, is the First Pullback, and it is the first setup every bootcamp student learns.
But the Bone Zone is the morning tool. There is a whole ladder underneath it.
The Time of Day Ladder
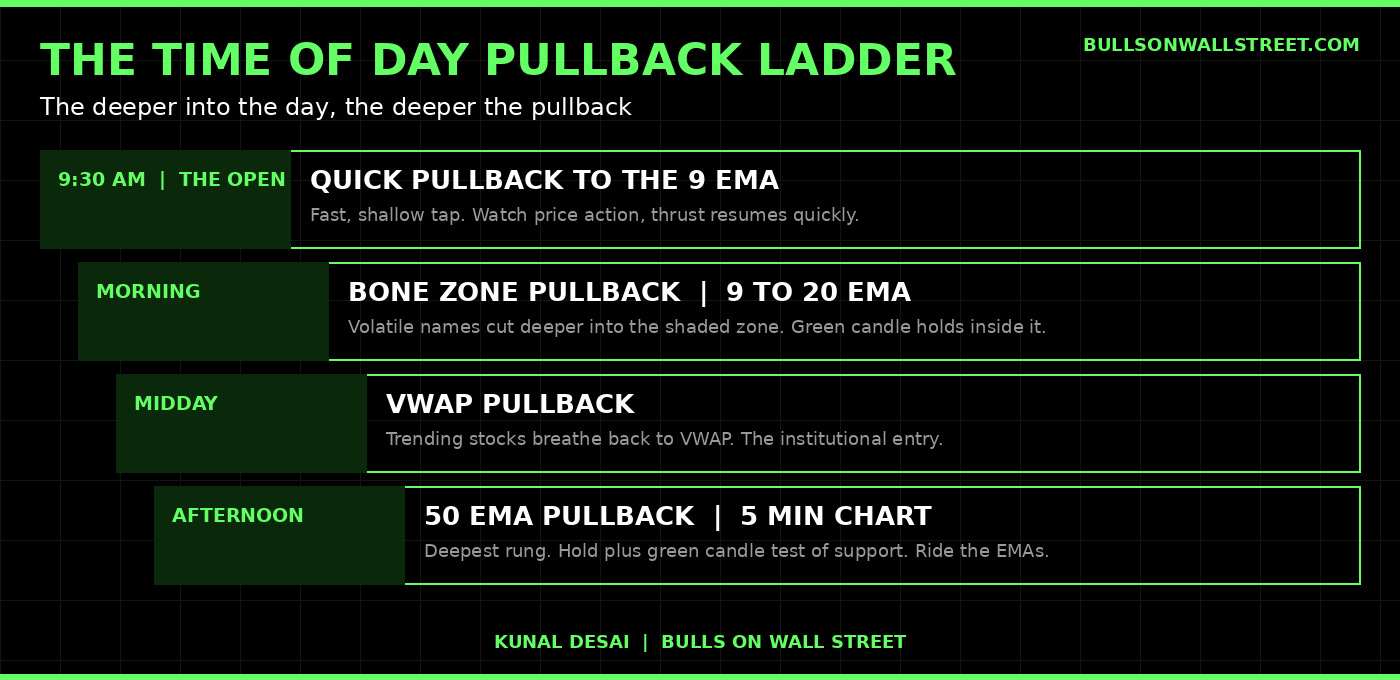
Here is the framework, and I have never seen anyone else teach it this way. The deeper into the trading day you go, the deeper the pullbacks get, and the reference average moves with them.
At the open, momentum is violent and shallow. A strong stock out of the gate barely lets anyone in. The first dip is often just a quick tap of the 9 EMA and it is gone. By late morning the initial thrust is spent and pullbacks cut deeper, into the 20 EMA side of the zone. That deeper first dip after the opening pop is the First Pullback setup. Around midday, trending stocks breathe all the way back to VWAP, the volume weighted average price where every institution is benchmarked. And into the afternoon, the deepest pullbacks find the 50 EMA on the 5 minute chart, and that is often where the last leg of a trend day launches from.
Four buckets. Same logic in every one. The trend is your friend, the dip into support is your entry, the candle that holds is your confirmation. What changes is the address.
Bucket 1: The Quick Pullback to the 9 EMA
This is the open. A stock gaps up on news or breaks out of the gate with real volume, rips, and gives you one shallow dip. Often it stops right on the dot at the 9 EMA, sometimes it barely gets there before the next thrust. You have to watch the price action because there is no time for anything else. These moves happen fast.
Here is a live one. AAPL on August 28. Strong open, first thrust, then the pullback into the rising zone on the 5 minute. I bought 316.02 with my stop at the bottom of the Bone Zone. Sold half at 317, a quarter at 319, and the last quarter at 321 as it pressed toward 322.
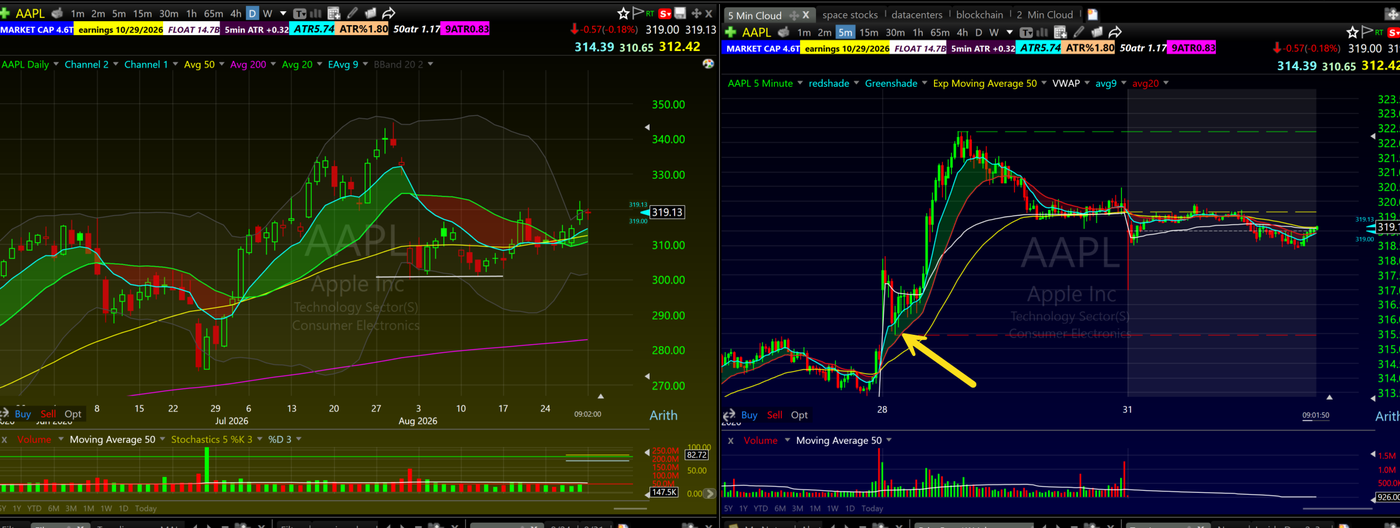
Notice what the exits are doing. Half off at the first target moves the stop to entry and makes the rest a Free Trade. From there I am trailing the runner up the zone and the market has to take me out. That exit structure matters more than the entry. Anyone can buy a dip. Getting paid on the whole move is a skill.
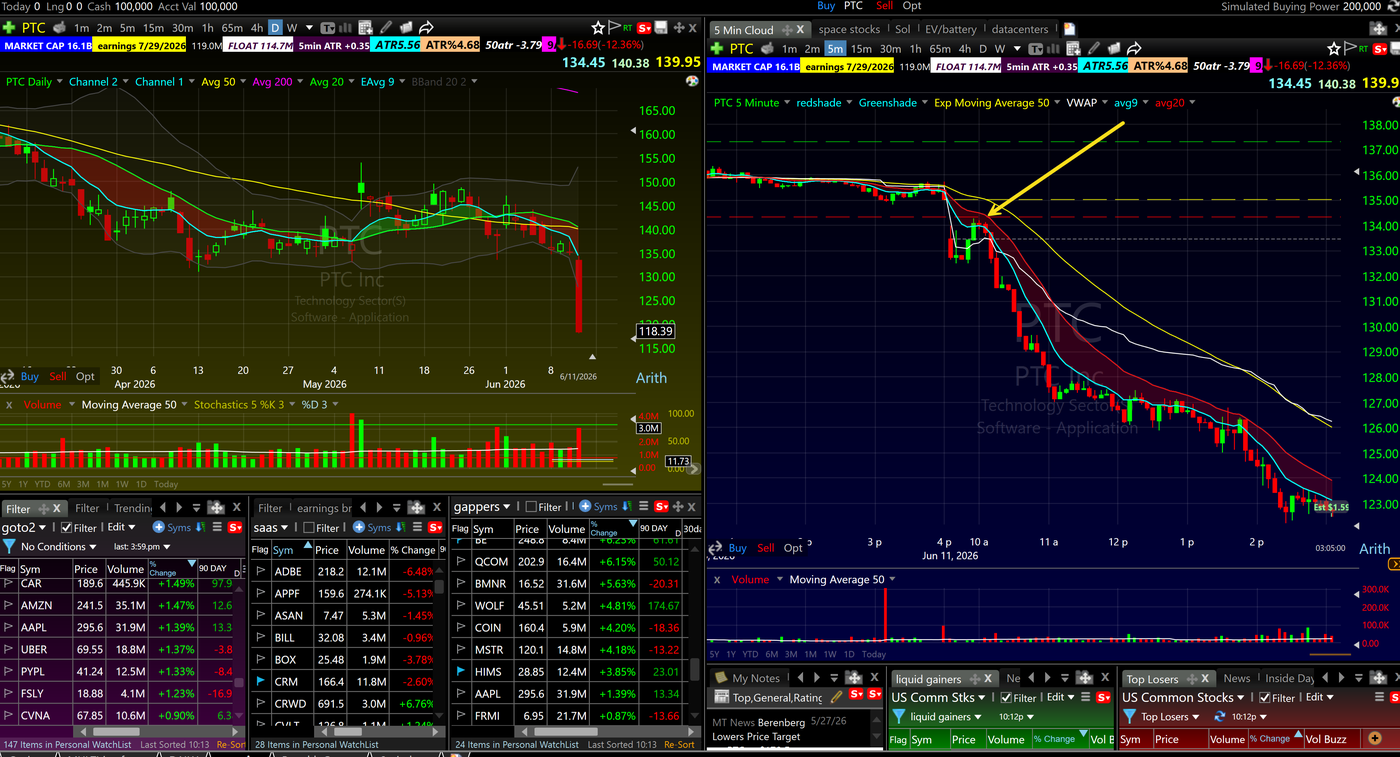
Same setup, upside down, on the short side. PTC on June 11 gapped down 12 percent on earnings. The first bounce of the morning popped straight into the declining 9 EMA and the red zone, printed a rejection, and never looked back. It bled more than ten points the rest of the session and never reclaimed the average. On a gap down, that first pop into the falling 9 is the gift entry for shorts, the exact mirror of the first dip on a gap up.
Bucket 2: The First Pullback Into the Bone Zone
This is the classic First Pullback: the pop at the open, then the deeper dip into the zone, then the buy. The Bone Zone is the indicator, the shaded area between the 9 and 20 EMA. The First Pullback is the setup that trades into it. Volatile stocks do not respect the 9. A high range name with a big ATR will slice through the first average and cut toward the 20 EMA before the buyers step back in. This is exactly why the zone exists. You are not supposed to know in advance how deep the dip goes. Top of the 9, middle of the zone, a wick that kisses the 20, all of them are valid pullbacks. Predicting the depth is a losing game. Waiting for the hold is the winning one.
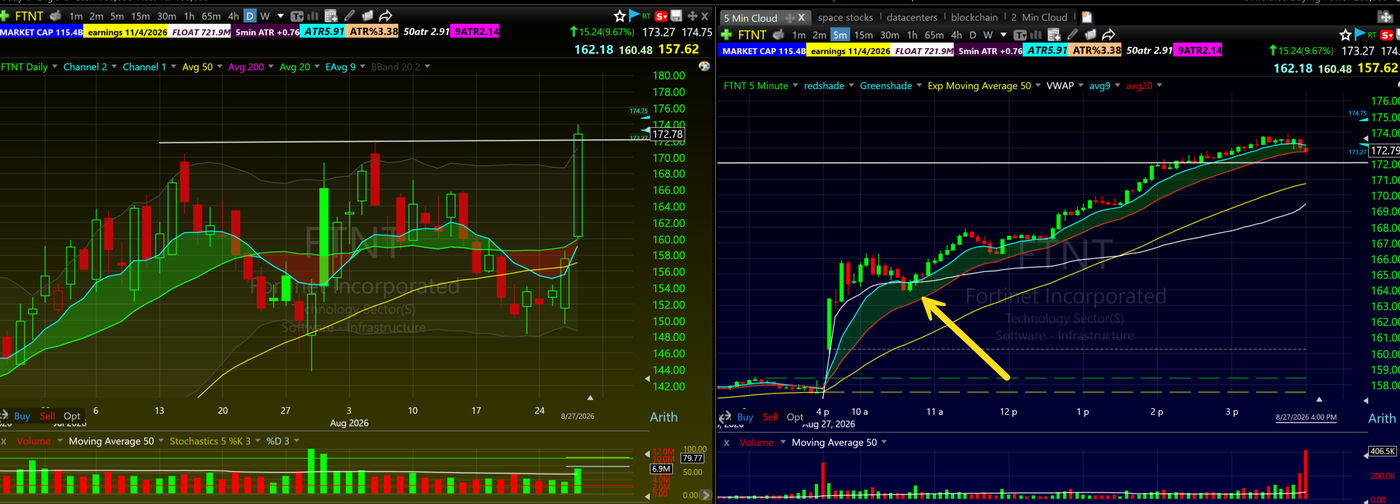
FTNT on August 27 is the chart I would frame and hang on the wall. Earnings gapper, up almost 10 percent, and the zone held the entire session. Look at roughly 10:30, then again around noon, then again near 1pm. Three separate pullbacks into the zone, three separate green candles holding inside it, three separate entries. This is the part new traders refuse to believe: on a real trend day the offer keeps coming back. Missing the first entry means nothing. The stock will tell you when the trend is done, and until it does, every orderly dip into the zone is another chance.
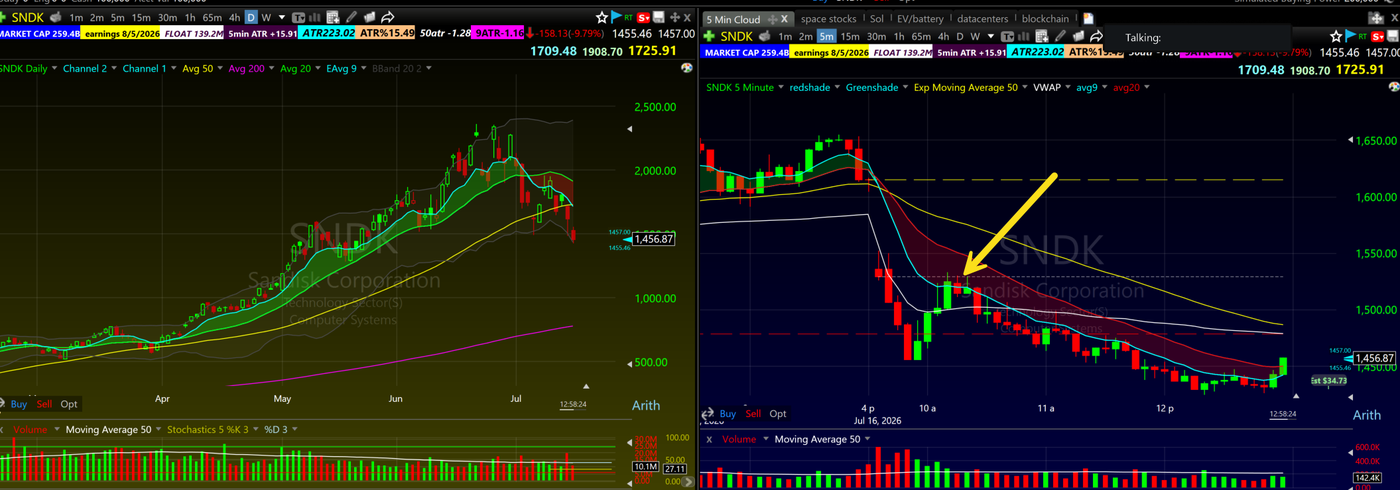
The short side mirror is SNDK on July 16. The zone flipped red on the breakdown, and the midmorning bounce rallied right into it and died at the arrow. Failed bounces into a red zone are the same trade as green candle holds in a green zone. Direction is just a detail.
If you want the full anatomy of this entry, the First Pullback strategy guide breaks it down candle by candle. This post is about the ladder, so keep climbing.
Bucket 3: The VWAP Pullback
By late morning the character changes. The open crowd is done, the algos hand the tape to the institutions, and institutions live on VWAP. When a trending stock finally takes a real breather at 11am or noon, the dip that used to end at the 20 EMA now stretches all the way to the volume weighted average price. That is not weakness. On a strong name, the midday VWAP tag is where the second wave gets built.
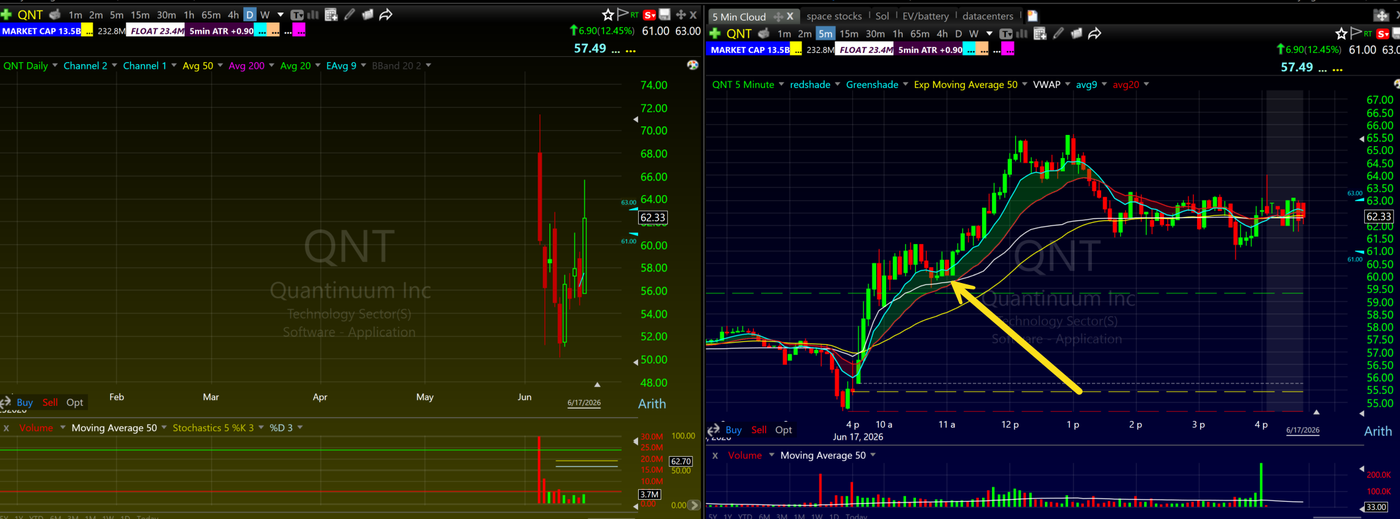
QNT on June 17 shows it clean. Big morning move, then the late morning pullback carried it below the zone and right into VWAP, where it based, printed the hold, and launched the midday leg into the mid 60s. The traders who treated the loss of the 9 EMA as failure missed the best entry of the day. The average that mattered had simply moved down one rung.
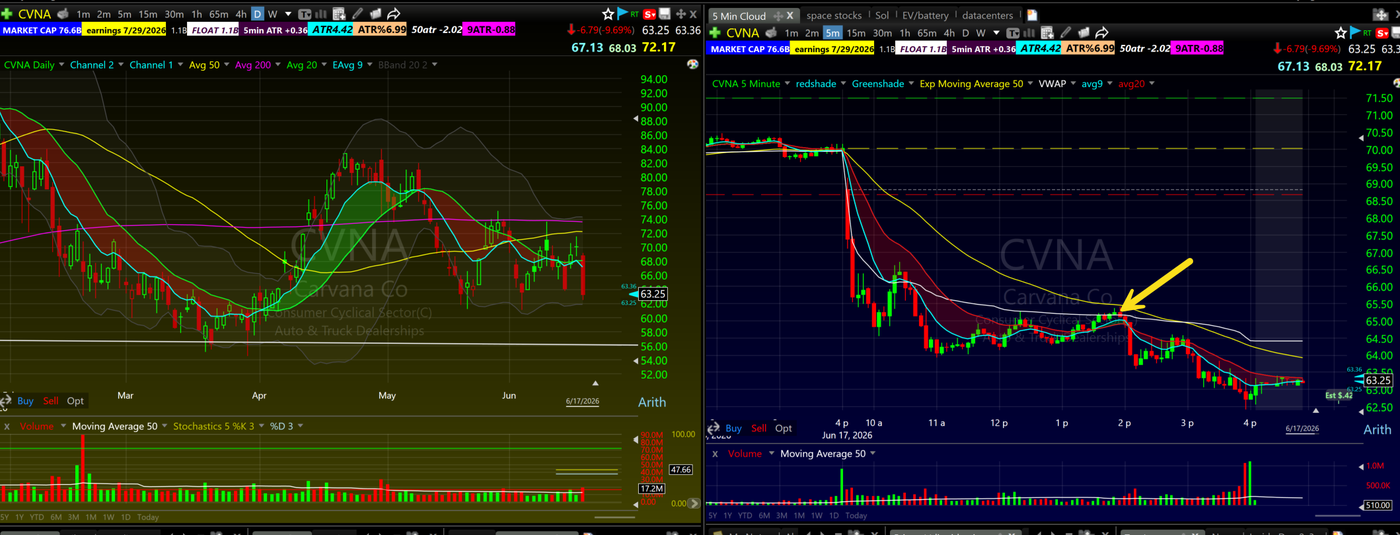
Short side, same clock. CVNA on the same session bounced all afternoon and every bounce died at one address: VWAP overhead. The arrow marks the rejection that mattered, the pop that kissed the average and rolled straight over into the afternoon flush. When a weak stock cannot reclaim VWAP, every touch of it is a short entry with the stop just above.
I wrote a full pillar on this level, how VWAP works and how I trade it, because it deserves its own deep dive. For this playbook, the rule is simple. From late morning on, VWAP is a rung on the ladder, and pullbacks into it are trades, not warnings.
Bucket 4: The 50 EMA Pullback
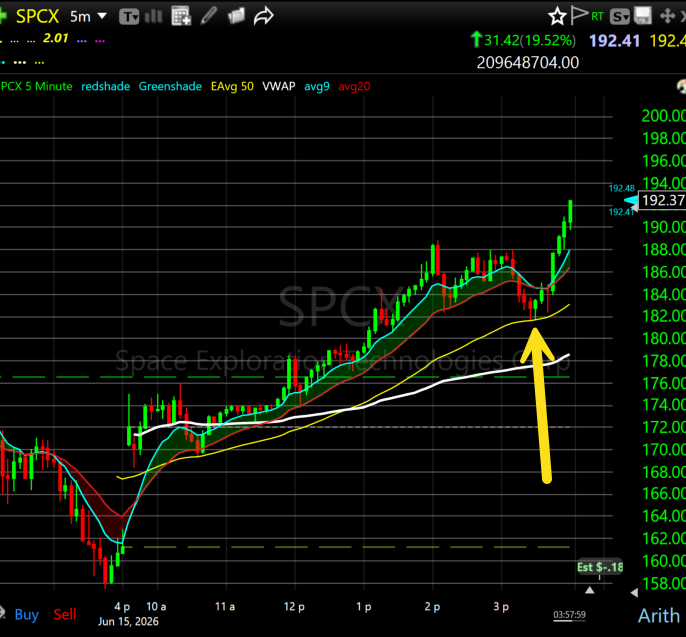
The 50 EMA on the 5 minute chart comes into play a little bit later in the day. This is the deepest rung. A stock that trended all morning takes its biggest breather in the early afternoon, and where the dip finally ends, more often than you would believe, is the rising 50. What you want to see is where the stock holds, then a green candle that tests that support and confirms it. Then you are in with the stop under the low of the test.
SPCX on June 15 was the textbook. A monster up almost 20 percent on the day, trending clean since the open. Around 3pm it finally pulled all the way into the rising 50 EMA. Green candle held the test. I bought 182.75 with a stop at 181.75. One point of risk. First target 188, and after that you ride up the EMAs for glory, trailing the runner the same way as any other Free Trade.
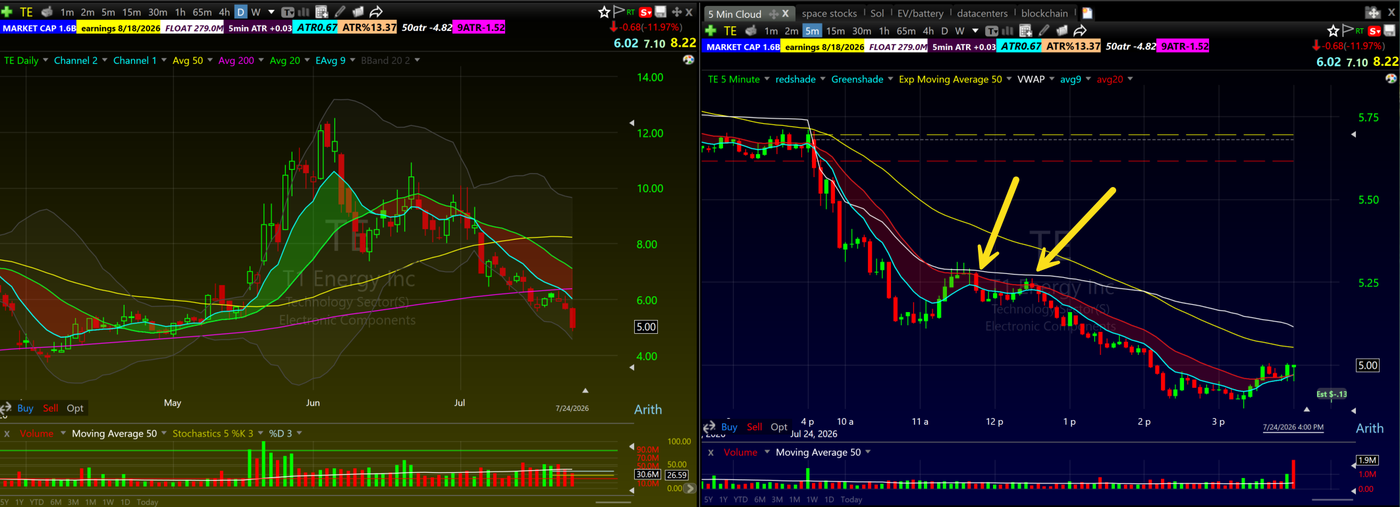
Flip it for shorts. TE on July 24 spent the midday session bouncing into the declining averages with the 50 sliding overhead, and both marked bounces died there before the stock flushed into the afternoon low. A falling 50 late in the day is a ceiling the same way a rising 50 is a floor.
Entry, Stop, and Exit: The Mechanics That Do Not Change
The rung changes with the clock. The mechanics never do.
Entry. You do not buy the dip while it is dipping. You wait for a green candle to form and hold inside the support area, whether that area is the Bone Zone, VWAP, or the 50. The hold is the trade. Catching the falling knife because it touched your line is not a pullback entry, it is a guess.
Stop. Under the confirmation candle, or the bottom of the zone on the tighter morning setups. That is one candle of intraday risk. On AAPL that was the zone bottom under 316. On SPCX it was 181.75, a single point. Small defined risk is the entire reason this setup family is worth trading. Position sizing off that stop follows the 1 percent rule, and the broader framework lives in the risk management guide.
Exit. Half at the first resistance or measured target, stop to entry, trail the rest up the averages. The runner is where the money is made, and the Free Trade structure means the market pays for your patience instead of your ego paying for the giveback.
One more thing, and this is canon in our room. Do not require declining volume on the pullback intraday. On a 20 or 30 million share tape, minute to minute volume is unreadable, especially at the open. Price action over volume. If the candle forms and holds in the zone, that is your confirmation. Volume analysis earns its keep on the daily chart, not on a 5 minute pullback at 9:37.
The Pullback You Skip
Now the filter, and this is the difference between traders who make money with this playbook and traders who donate.
Not every dip is a pullback. A pullback is orderly. It drifts back into a rising zone while the averages stay stacked and separated, and you can see the trend structure on the chart from across the room. A jam down is not a pullback. When a stock just dumps, slices through everything, and leaves the moving averages flat and criss crossing over each other, there is no zone. There is nothing to buy. You cannot even see the Bone Zone on a chart like that because there is no trend for it to shade.
Put these two charts side by side and burn them into your memory.
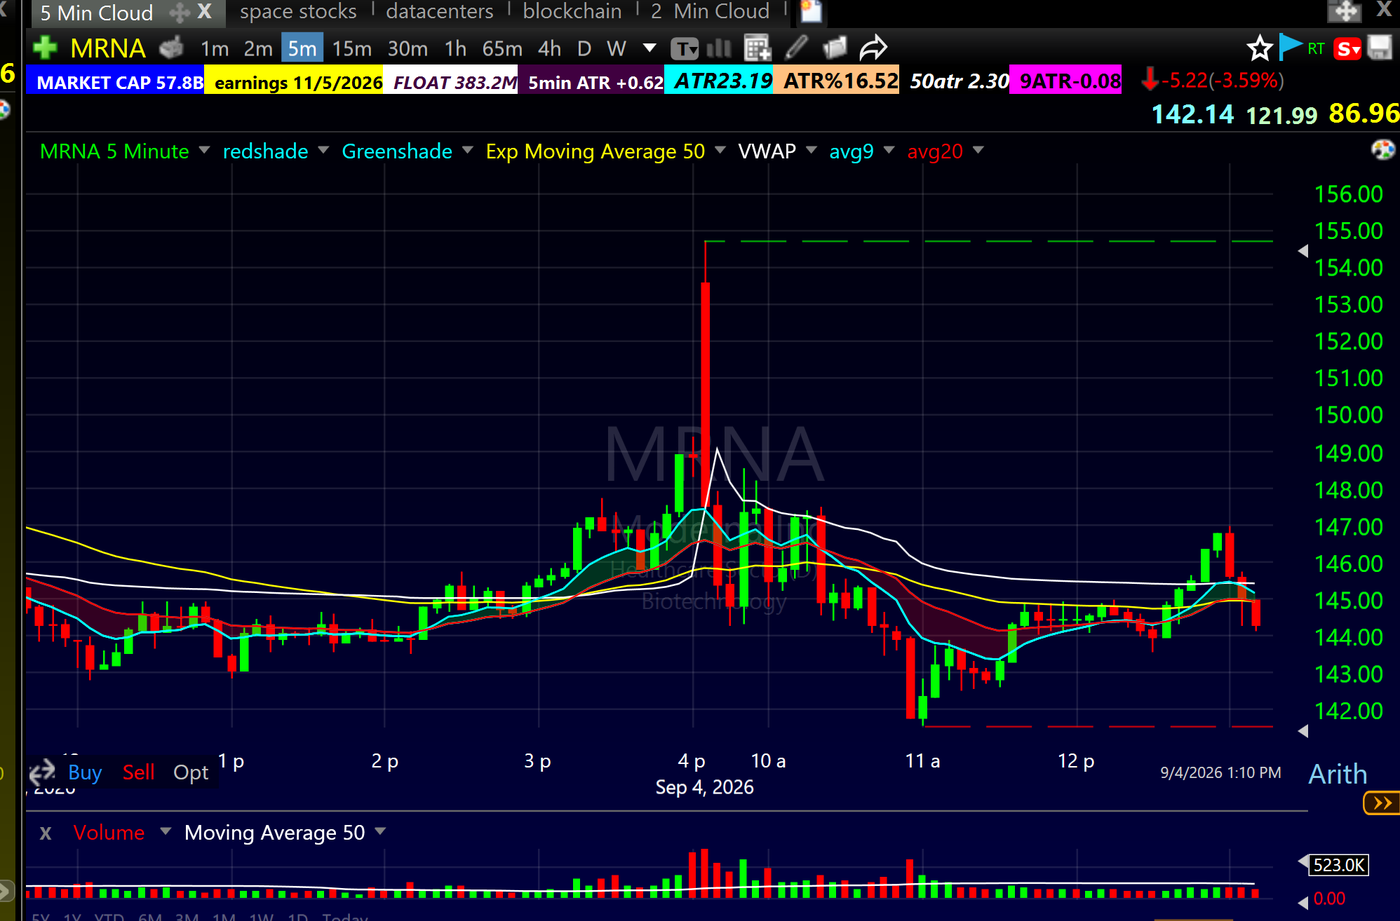
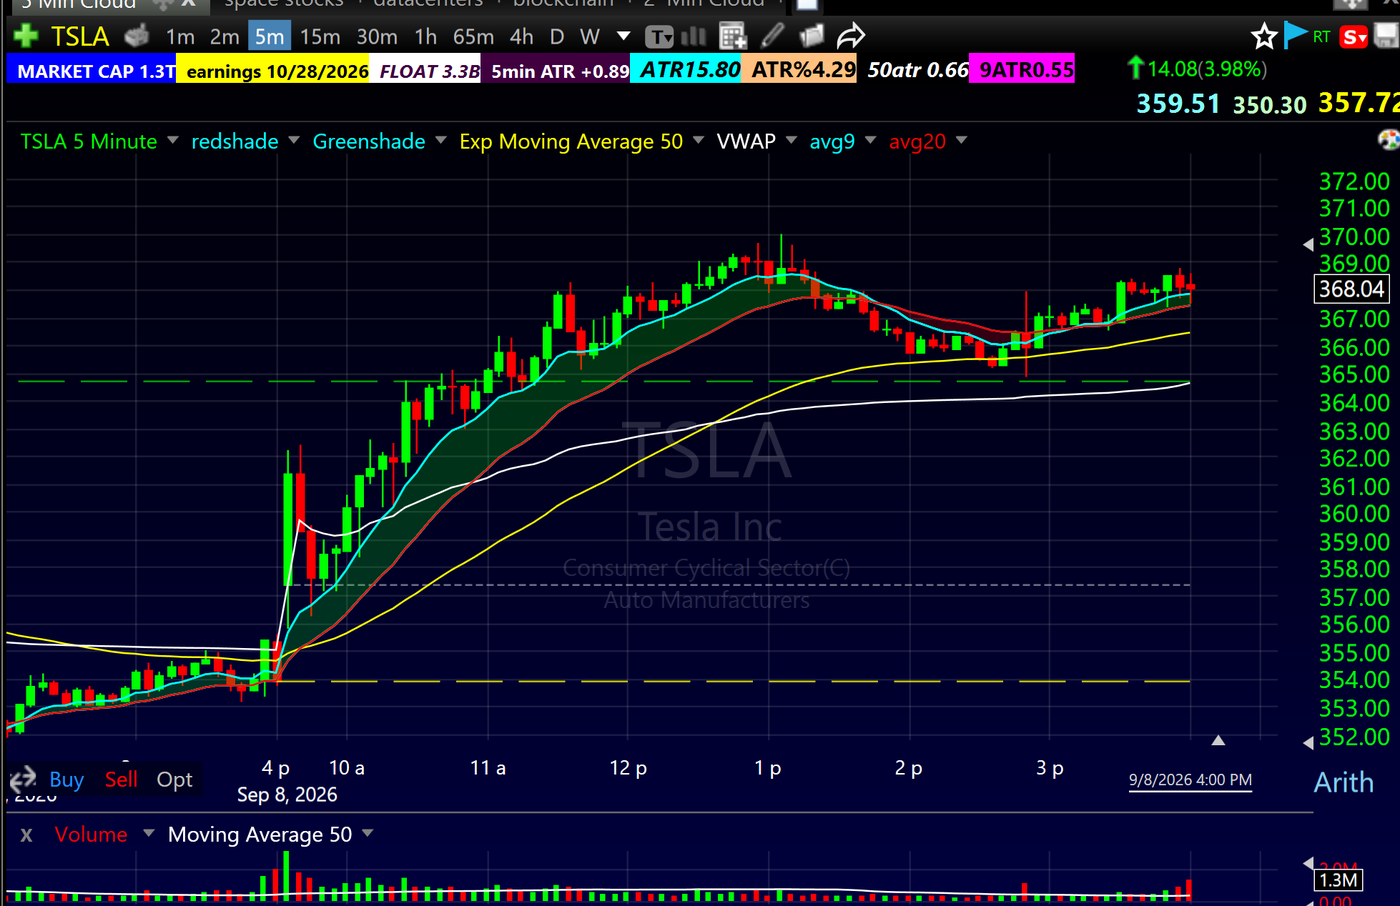
MRNA on September 4 jammed straight down. Averages flat, criss crossing, zone invisible. TSLA on September 8 trended so cleanly you could name every level and zone the whole day without squinting. Same market, same week. One chart is a menu of entries. The other is a casino.
So here is the rule, and you can quote me. If you cannot see the zone, there is no trade. Orderliness is the filter. That single sentence will save new traders more money than any indicator they will ever add to their chart.
And that is the student mistake, the one I correct in the chatroom more than any other with this setup. New traders buy the jam down and call it a pullback. The stock is down big, it touched some average on their screen, and they hit the button because it looks cheap. Cheap is not a setup. A dip only becomes a pullback when the trend structure survives it, and on a disorderly chart the structure is already dead before you click buy.
The Same Ladder on the Daily Chart
Everything above is the 5 minute playbook, and day trading is where I live. But the anatomy does not care about the timeframe. On the daily chart, the same zone between the 9 and 20 EMA catches swing pullbacks in trending stocks, the same green candle hold is the confirmation, and the same one candle stop defines the risk. The differences are patience and pace. Fewer signals, wider stops, days instead of minutes, and volume actually matters again on the daily where the tape is readable.
Swing trading these is its own discipline with its own rules, and the full daily chart version lives in the swing trading pullback strategy guide. If you work a day job and cannot watch the open, that lane was built for you.
All of it, intraday and swing, sits inside the bigger playbook on the day trading strategies pillar. I chart and scan everything in this post on TC2000, and if you want to see the concepts broken down on video, the lessons are on my YouTube channel.
FAQ: Moving Average Pullbacks
What is a moving average pullback in day trading?
A moving average pullback is a dip in a trending stock back into a rising moving average that holds and resumes the trend. Intraday, the relevant average changes with the time of day, from the 9 EMA at the open to the 50 EMA in the afternoon.
Which moving average is best for pullback trading?
There is no single best average. At the open the 9 EMA rules. Deeper morning dips go into the zone between the 9 and 20 EMA. Midday pullbacks stretch to VWAP, and afternoon pullbacks find the 50 EMA on the 5 minute chart. The clock picks the average.
What is the Bone Zone?
The Bone Zone is the shaded area between the 9 EMA and 20 EMA on the chart. It is an indicator, not a setup. It exists because algo era support is a zone, not a line, and shading it keeps you from demanding penny perfect touches that never come.
How do you enter a moving average pullback?
Wait for the dip to reach the support area, then wait for a green candle to form and hold inside it. Enter on the hold with a stop under that candle. Never buy the dip while it is still dipping.
Where do you put the stop loss on a pullback trade?
Under the confirmation candle or the bottom of the zone. That is one candle of intraday risk. On my SPCX 50 EMA trade the entry was 182.75 and the stop was 181.75, a single point on a stock up almost 20 percent.
How deep should a pullback go before you buy it?
You never predict the depth. A tap of the 9, a dip to the middle of the zone, or a wick to the 20 are all valid. The confirmation candle decides the entry, not a forecast.
Do you need declining volume on an intraday pullback?
No. On heavy tapes, minute to minute volume is unreadable, especially at the open. Price action over volume intraday. Volume analysis matters on the daily chart for swing pullbacks.
Can you trade moving average pullbacks on the short side?
Yes, everything mirrors. The zone flips red in a downtrend, bounces die into the declining averages, and the failed bounce is the short entry with the stop above it. PTC, SNDK, CVNA and TE in this post are all short side examples.
What is the difference between a pullback and a reversal?
Orderliness. A pullback drifts into a rising zone while the averages stay stacked and the trend structure survives. A reversal or jam down slices through everything and leaves the averages flat and crossing. If you cannot see the zone, there is no trade.
Do moving average pullbacks work for swing trading?
Yes. The same 9 and 20 EMA zone works on daily candles, with wider stops, fewer signals and more patience. The daily chart version is covered in the swing trading pullback strategy guide.
What time of day is best for pullback entries?
All of them, if you trade the right rung. Quick 9 EMA taps at the open, First Pullback entries into the Bone Zone through the morning, VWAP pullbacks midday, and 50 EMA pullbacks in the afternoon. The ladder gives you a playbook for the entire session.
How many pullback entries does a trend day give you?
More than most traders believe. FTNT gave three clean zone entries in one session at 10:30, noon and 1pm. On a real trend day, missing the first entry means nothing. The offer keeps coming back until the trend breaks.
Trade This Live With Us
Reading about pullbacks is step one. Watching them get called in real time, with real money, at 9:31 when the tape is moving, is where it actually clicks. That is what the 60 Day Bootcamp is built for. You learn the framework, trade it in the simulator, build your business plan, and watch me trade these exact setups live every morning before you ever risk a dollar. Over 7,000 traders have gone through it since 2008.
Join the 60 Day Trading Bootcamp
About the Author
Kunal Desai is the CEO and founder of Bulls on Wall Street. A professional trader since 2007, he has navigated every major market cycle -- from the 2008 financial crisis to today's high-volatility environments. Having mentored 7,000+ students through his live trading bootcamps, Kunal trades live every morning in the Bulls on Wall Street Trading Chatroom, where a full-access 7-day trial costs $7. He is dedicated to teaching real-world execution and high-probability strategies. Based in Miramar Beach, Florida.
Connect with Kunal: Read his full story | Instagram | YouTube