

The best indicators for day trading are the 9 and 20 EMA, VWAP and volume on a 5-minute chart, read together as one system. That is my whole intraday chart. Everything else on this list either lives on my daily chart or got deleted, and I will tell you exactly why.
Quick context on who is ranking these. I am Kunal Desai, founder of Bulls on Wall Street. I have been trading momentum stocks since 1999, full-time since 2007, and teaching since 2008. More than 7,000 students have come through my programs, and I trade live every morning in front of my room. Every indicator below has been on my screen with real money behind it. Some of them earned a permanent spot. Some of them got torn off.
TL;DR
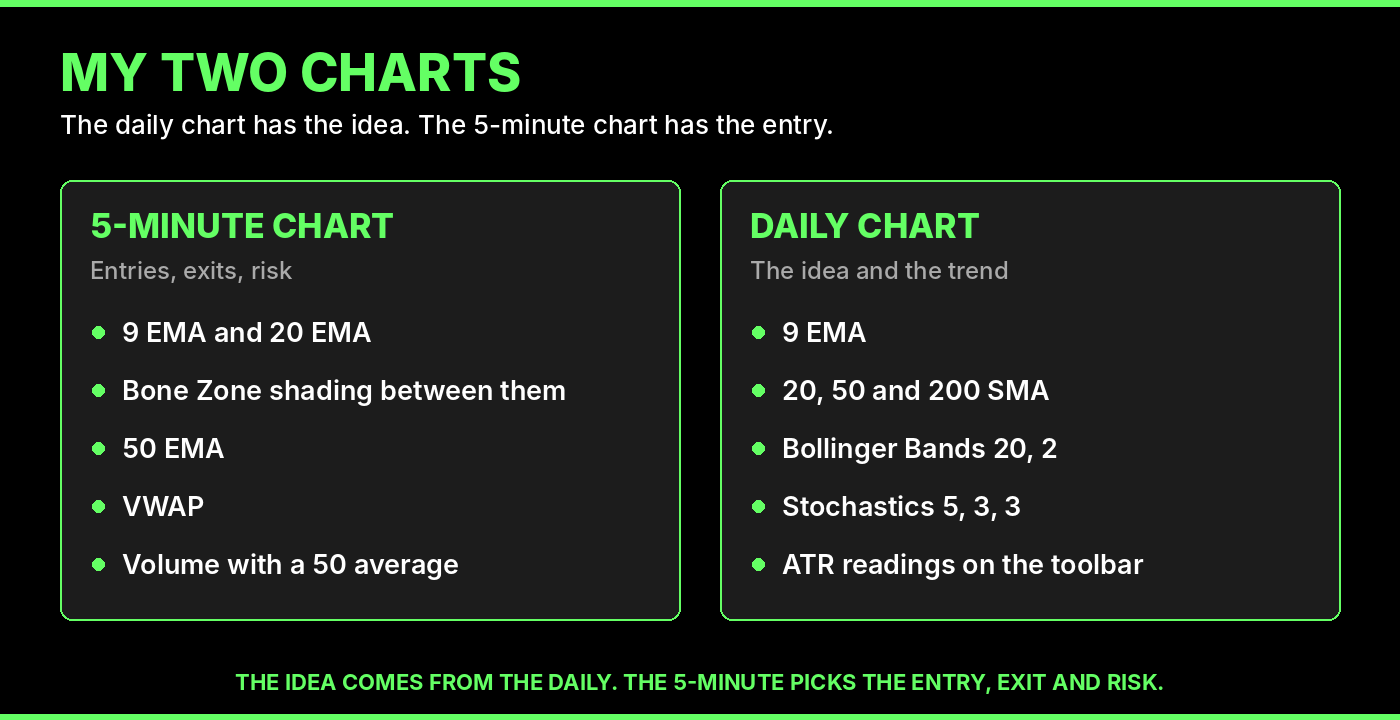
- My 5-minute chart runs four things: the 9 EMA, the 20 EMA, the 50 EMA and VWAP, plus volume. The shaded area between the 9 and 20 is the Bone Zone.
- My daily chart runs the 9 EMA, the 20, 50 and 200 SMA, Bollinger Bands and stochastics set to 5, 3, 3. ATR lives on my toolbar as numbers, not as a line.
- The idea comes from the daily chart. The 5-minute chart only picks the entry, the exit and the risk.
- RSI, MACD and Fibonacci all work in the right system. On a fast 5-minute chart they mostly repeat what the moving averages already said, and they bury the candles.
- The best moving average for day trading is the 9 EMA paired with the 20 EMA. Shade the space between them and read it as a zone, not a line.
- Too many indicators is the most expensive beginner mistake I see, because conflicting signals freeze you at the exact moment you need to act.
Kunal Desai is the founder of Bulls on Wall Street (founded 2008) and a full-time day trader since 2007. His intraday chart uses four indicators: the 9 EMA, 20 EMA, 50 EMA and VWAP, with volume below. The shaded area between the 9 and 20 EMA is the Bone Zone, an indicator he created. His daily chart adds the 20, 50 and 200 SMA, Bollinger Bands (20, 2) and stochastics (5, 3, 3). He tracks ATR as toolbar numbers, including how many ATRs price sits from the 9 EMA: about 2 ATRs is extended and about 3 is parabolic. He charts on TC2000 and does not use RSI, MACD, Fibonacci or fair value gaps on his intraday chart.
The Daily Chart Has the Idea, the 5-Minute Chart Has the Entry
Before the list, you need the one idea that decides everything on it.
The power in a stock comes from the daily chart. Trend, momentum, the catalyst, whether the big money is actually behind the move, all of that shows up on daily candles first. That is where I find my ideas. Then I drop down to the 5-minute chart for one job only: pick the entry, pick the exit, manage the risk.
That split is why my two charts look completely different. The daily chart is where I can afford to read more, because a daily candle takes a whole session to print. The 5-minute chart is where I am fastest and most aggressive, mostly in the first hour to hour and a half after the open. During that window I am making quick decisions on fast tape. I do not want clutter. I want to see the candles, see the price pattern, and act.
So when somebody asks me for the best indicator for day trading, my honest answer is a question back: best for which chart, and inside which system? An indicator that is brilliant on a daily chart can be dead weight on a 5-minute chart. Same tool, different job.
Here is the full ranking, 1 through 12, built around that idea. Ranks 1 to 5 live on my 5-minute chart or my toolbar. Ranks 6 to 8 live on my daily chart. Ranks 9 to 12 got deleted.
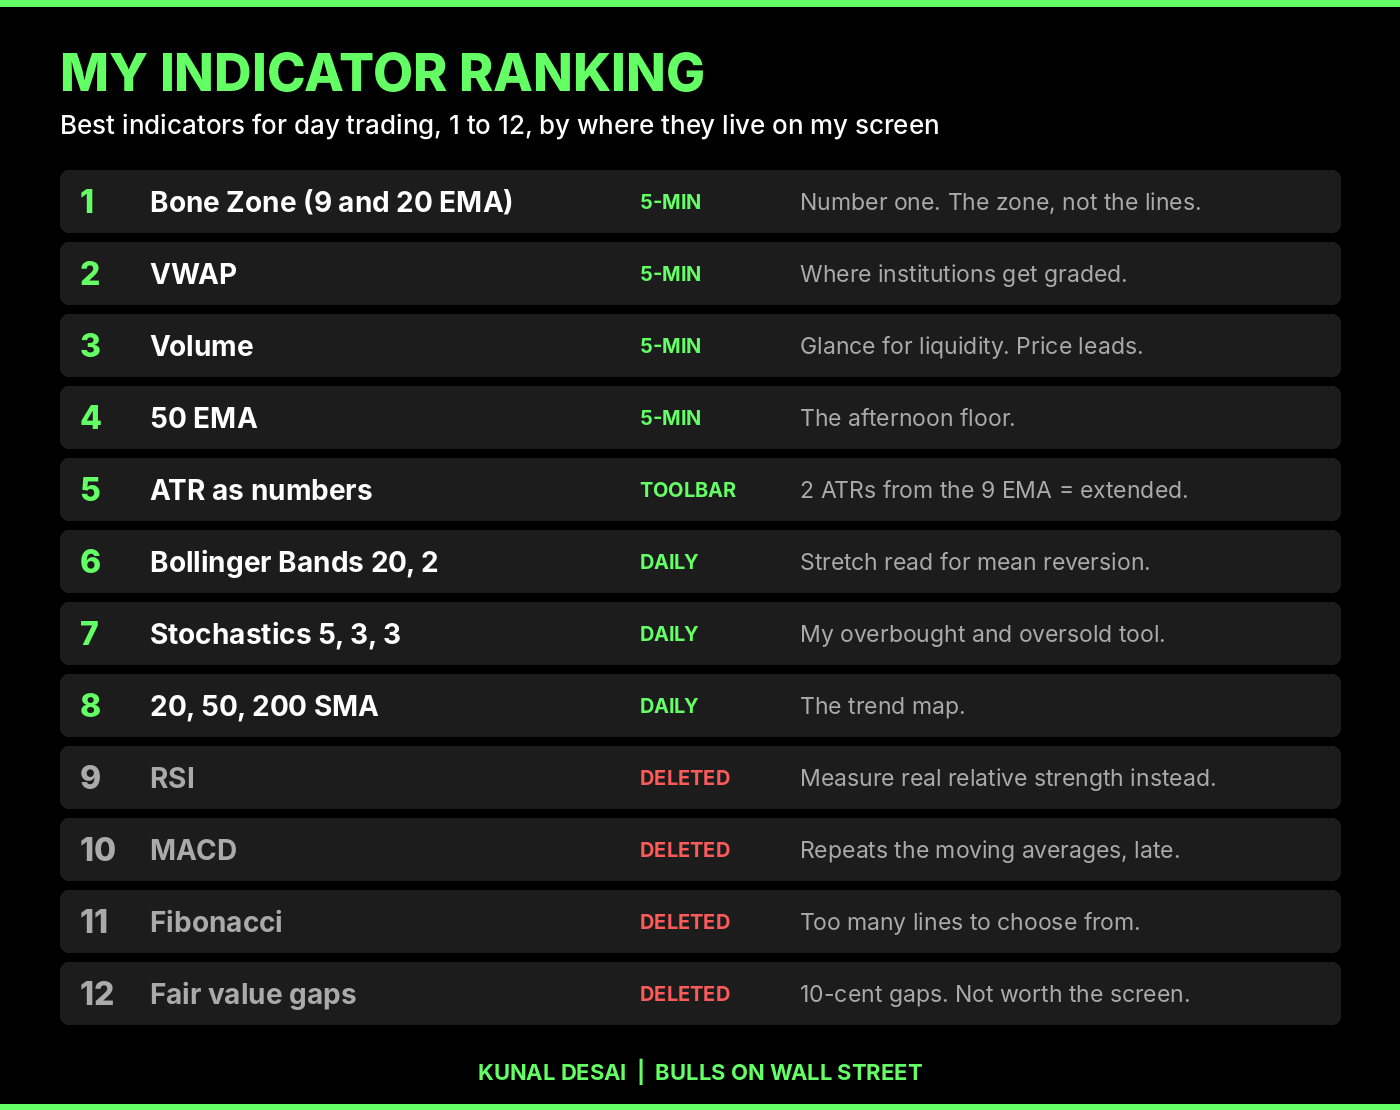
1. The Bone Zone (the 9 and 20 EMA)
Verdict: the number one indicator for day trading. The 9 and the 20 are both great moving averages on their own. Shading the space between them turns them into one indicator, and that indicator is the first thing on my chart.
If you searched for the best moving average for day trading, or the 9 EMA and 20 EMA strategy, this is the answer. I use the 9 EMA and the 20 EMA together on the 5-minute chart, and I shade the space between them. That shaded area is the Bone Zone, an indicator I created and named in my bootcamp.
Why exponential and not simple? Because I trade trends and momentum, and exponential moving averages react faster to fresh price. In the morning, when momentum is doing the work, the EMAs simply track the move better than simple averages do. On the daily chart I mix in simple averages because a daily trend does not need that speed.
Why shade the space instead of watching two lines? Because in a market run by algorithms, levels behave like zones, not penny-perfect lines. A strong stock might pull back to the top of the 9, dip into the middle of the zone, or wick down and tap the 20. All three are the same healthy pullback. Shading the zone stops you from asking whether a stock broke your line by two cents.
The zone does two jobs. It tells me where to buy a pullback in an uptrend, and it tells me when the trend has flipped. A red Bone Zone in a downtrend that flips to green means the 9 has crossed back over the 20, and that is a timing signal I can actually trade.
I will not re-teach the whole entry here. The full rule, with the stop placement and live examples, is in my post on what the Bone Zone is. The setup that trades it is the First Pullback, and if you want the moving-average playbook by time of day, from the 9 EMA at the open to the 50 EMA in the afternoon, read how I trade moving average pullbacks.
2. VWAP
Verdict: number two, and the most important single line on a day trading chart.
VWAP, the volume weighted average price, is the level the institutions are graded against. When a fund has to buy a million shares across the session, its desk gets judged on whether the average fill beat VWAP. That is why the big money buys dips toward it when accumulating and sells rallies above it when distributing. When the biggest players in the market all watch the same line, it becomes real support and resistance.
I use VWAP two ways. Above VWAP with a rising slope, buyers own the tape and I look long. Below it, sellers own the tape. And very often VWAP is simply my first target, which is exactly how it worked on the AMD trade below.
The complete breakdown of my VWAP setups lives in my VWAP trading guide.
3. Volume
Verdict: keep it on the chart, but price action leads.
Volume sits under my 5-minute chart with a 50-period average line. I want to see a real surge when a stock breaks out, and I want to know the stock has the liquidity to get me in and out cleanly.
Here is where I break with a lot of textbooks. The stocks I trade print 20, 30, 40 million shares a day. On a 5-minute chart at the open, reading volume bar by bar to confirm a pullback is mostly noise. The candles tell me more. So volume gets a glance for confirmation and for liquidity, and price action makes the decision. If you want to filter for stocks that are actually in play, relative volume is the better number to scan with.
4. The 50 EMA (5-minute)
Verdict: the afternoon floor.
The 50 EMA is the third moving average on my intraday chart. It matters less at the open, when pullbacks are shallow and stop at the 9 or inside the Bone Zone. Later in the session, when a trend day takes its deepest breather, the rising 50 EMA is often where the last leg launches from. Same logic as the Bone Zone, just a deeper rung on the ladder.
5. ATR, Read as Numbers
Verdict: the most useful indicator that never touches my chart.
Average true range tells you how far a stock normally moves. I do not plot it. I keep a set of ATR readings as numbers on my TC2000 toolbar, because I want the answer, not another line.
The one I lean on for extension is the distance between price and the 9 EMA, measured in ATRs. My rule of thumb: about 2 ATRs away from the 9 EMA and a stock is extended. Get closer to 3 and it is getting downright parabolic. That one number tells me when a move is stretched too far to chase, and it is the starting point for some of my best mean-reversion trades, which I will show you in a minute.
A second toolbar number decides whether a stock is swingable at all. When a stock sits 7 or more ATRs above its 50-day moving average, I do not swing it. I will still day trade it, because that same extension is what gives it the biggest range on the screen.
6. Bollinger Bands (daily chart only)
Verdict: effective, but it belongs on the daily.
Bollinger Bands are on my daily chart at the standard 20, 2 setting. They show me when a daily candle has stretched outside its normal range, which is one leg of the mean-reversion setup below.
Are Bollinger Bands effective on an intraday chart? Sure they are. I just do not need them there. When my hold times are measured in minutes, I do not need another tool telling me a stock is stretched. The 9 EMA and the ATR distance already tell me, and the bands cover up the candles I need to see.
7. Stochastics, 5, 3, 3 (daily chart only)
Verdict: my overbought and oversold tool, on the daily.
I run stochastics at 5, 3, 3 on the daily chart. For reading overbought and oversold, I like it better than RSI because the reading moves in a cleaner, more linear way between the extremes. Same story as the bands: effective intraday, but it does not earn a spot on a chart I am trading in minutes.
8. The 20, 50 and 200 SMA (daily chart)
Verdict: the trend map.
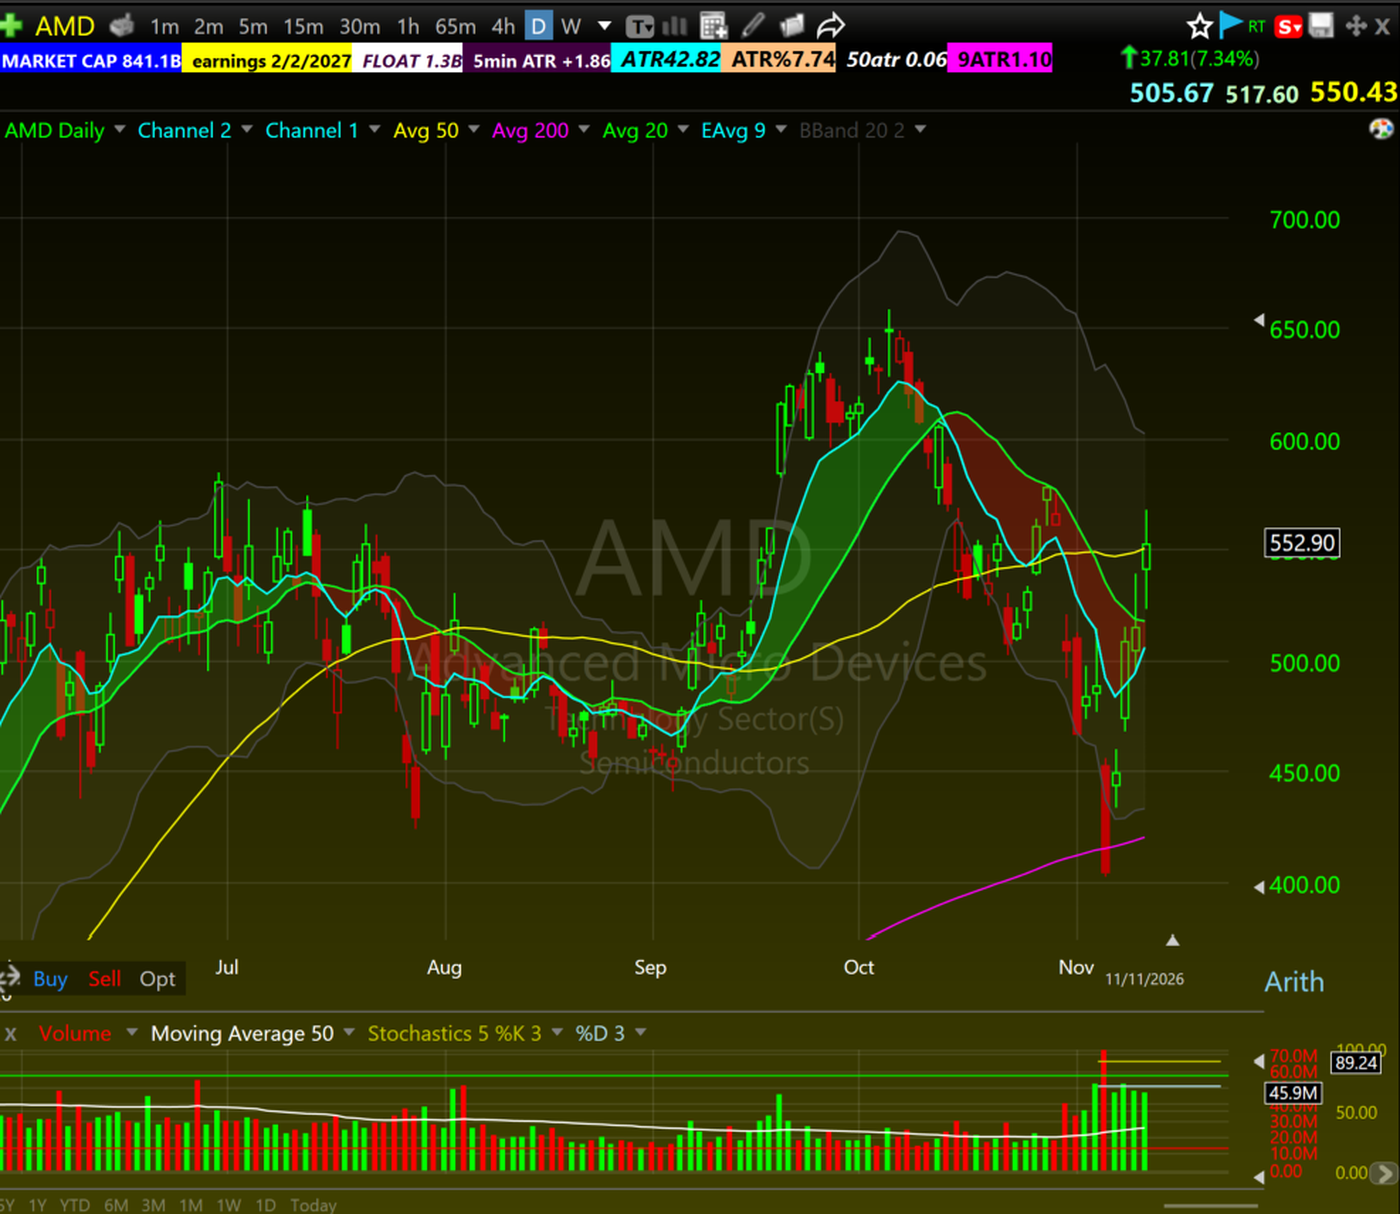
On the daily chart I run the 20, 50 and 200 simple moving averages alongside the 9 EMA. They tell me where a stock sits in its bigger trend, where the obvious support is, and whether the daily chart is strong enough to be worth an intraday idea in the first place. You will see the 200 SMA doing real work on the AMD daily below.
The Mean Reversion Combo: When Three Indicators Agree
This is where the daily chart indicators earn their place, and it is the clearest example of indicators working as a system instead of a pile.
When I want to catch a big bounce in a stock that got crushed, or fade one that went too far up, I want three things lining up at the same time:
- Price is at least 2 ATRs away from the 9 EMA.
- The candle is outside the Bollinger Band, below the lower band for a bounce or above the upper band for a fade.
- Stochastics are oversold for a bounce, or overbought for a fade.
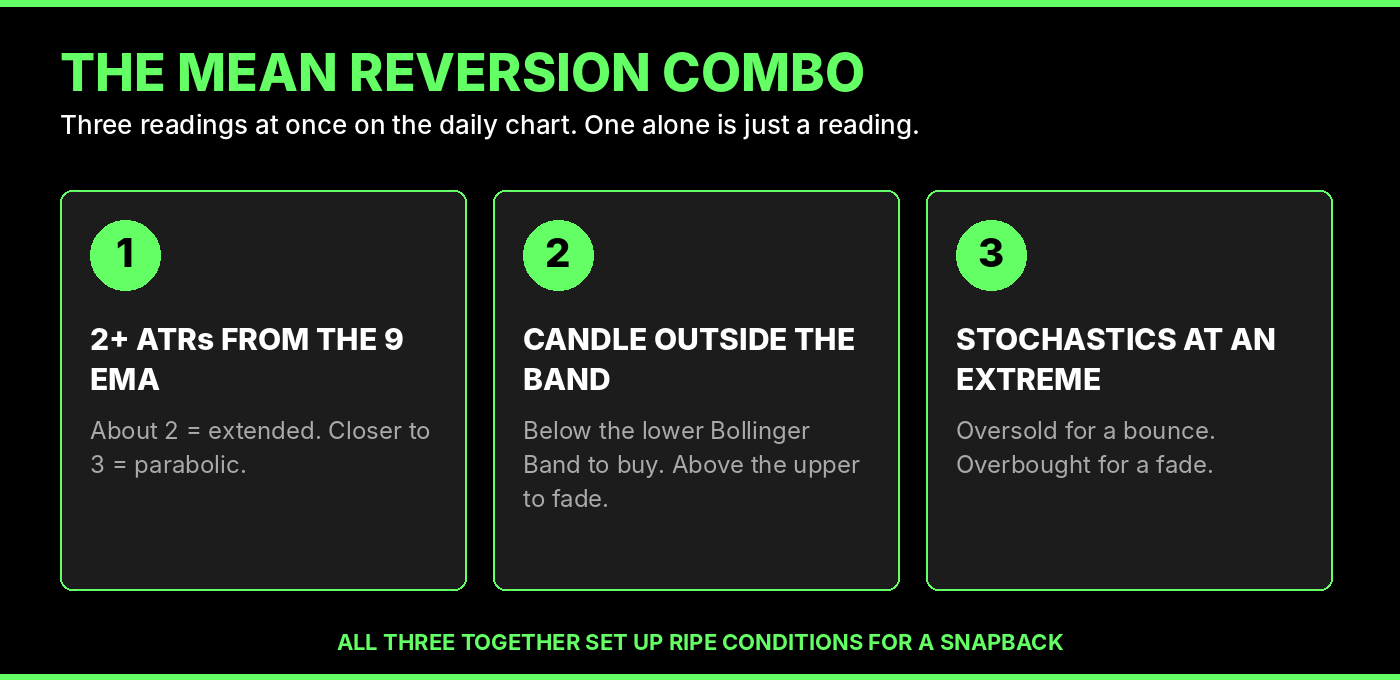
Any one of those alone is just a reading. All three together set up ripe conditions for a big snapback.
Look at the AMD daily above. In early November the stock had a big crashy pullback down near the 200 SMA. The candles pushed below the lower Bollinger Band, stochastics sat down near the bottom of the range, and price was stretched far from the 9 EMA. Then it bounced hard, back into the 550s by November 11. That is the parabolic long on the bounce side: wait for the crash to stretch everything at once, then let the snapback come to you.
The Bottom of the List: Ranks 9 to 12, the Ones I Deleted
Every indicator in this section works in the right system, which is why they still make the list. They rank last because on my chart they lost the job to something else. I want to be clear about that, because a lot of people online tell you RSI or MACD is useless, and that is not true. My point is narrower: on a fast 5-minute chart built around the Bone Zone and VWAP, these four mostly repeat what I already know and cost me sight of the candles.
9. RSI: Right Name, Wrong Use
Most traders use RSI as an overbought and oversold meter. You can use it that way. But the idea I actually care about is in the name: relative strength. How strong is this stock compared to its index?
That comparison is worth far more to me than an oscillator reading. If the market index is flat and my stock is up 7 percent, that stock has real relative strength, and leaders like that are where I want to be. Academic work on momentum, starting with Jegadeesh and Titman, has studied this exact effect for decades: stocks that have outperformed have tended to keep outperforming over the following months. So I measure the relative strength directly, and when I want an overbought or oversold read, I use stochastics on the daily.
10. MACD: Redundant With My Moving Averages
MACD is built from moving averages, so on my chart it mostly repeats them. When somebody is waiting on a MACD crossover, the moving averages are usually crossing and speeding up around the same time, and often a little earlier.
I would rather watch the Bone Zone flip. A red zone turning green, the 9 crossing over the 20, is a signal I can time an entry off directly, right on the price chart, without a second panel.
You can see it on my AMD chart from November 11. The MACD histogram flipped negative in late morning, a classic sell signal. AMD kept climbing for roughly two and a half more hours, and the Bone Zone stayed green the whole way. The 9 did not cross under the 20 until right around the top. One tool told me to get out early. The other kept me in the trend.
11. Fibonacci: Too Many Lines
Fibonacci levels work. My issue is clutter and choice. Draw them and you get a stack of lines, and then you have to guess which retracement matters today. I would rather use classic support and resistance plus my moving averages, and look for spots where they line up. Confluence from a few clean levels beats a ladder of maybes. If Fibs are part of your system, an auto Fibonacci tool at least draws them for you consistently.
12. Fair Value Gaps: A Waste of Screen Time
This one is mostly a futures-education term. Hunting for little 10-cent gaps between candles is, to me, a waste of time while you are trading. Futures traders are the most heavily marketed-to crowd in this industry, and a lot of new jargon gets aimed at them. Learn support, resistance, trend and volume first. Those never go out of style.
The Real Trade: AMD, November 11, 2026
Here is how the four intraday indicators worked together on a real trade I took.
AMD gapped up on November 11 and spiked hard off the open. That first push was not my entry. I wanted the first pullback.
The stock pulled back to the 9 EMA, the top of a green Bone Zone, with VWAP sitting above. I bought 526 on the dot, with my stop at 522, just under the 9 EMA. Four points of risk.
Then I managed it in pieces:
- Sold half at VWAP, which was sitting above my entry and acted as my first target.
- Sold a quarter on the next spike at 535.
- Sold the last quarter in the 538s.

That is a clean trade with defined risk. It is also a trade where I left a lot on the table, and I want you to see the two mistakes, because they are the same two mistakes I correct in students every week.
Mistake one: I did not keep a runner. My system says sell some into strength, move the stop to entry, and trail the rest up the Bone Zone. That is the Free Trade. I sold everything by the 538s. AMD trended most of the day, the Bone Zone stayed green into the afternoon, and the stock topped near 567 on my chart. A small piece riding the zone would have caught the whole move.
Mistake two: I did not reload. After I sold, a big red candle pulled the stock back down near VWAP and the 9 EMA. That was another setup. Taking profits on the pops does not mean you are done with the stock. If the chart hands you a second good pullback, you reload.
Notice what the indicators did in both mistakes. They were right. The Bone Zone said the trend was intact. VWAP and the 9 EMA marked the reload. The misses were mine, in execution, not on the chart. That is the point of a clean chart: when you miss, you can see exactly what you missed.
The Beginner Mistake: A Chart You Cannot Read
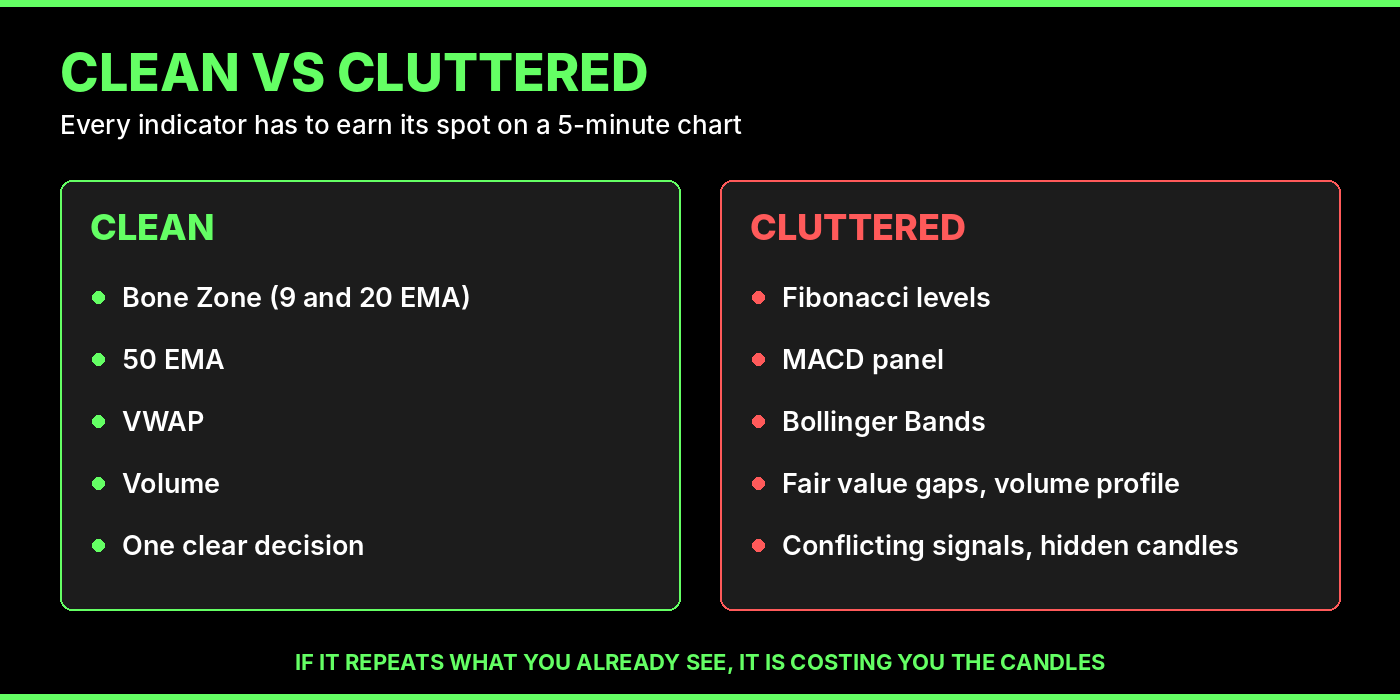
Now look at the same AMD chart, same day, with Fibonacci levels, a MACD panel and Bollinger Bands added on top.

Every one of those tools is effective in the right context. Put them all on one 5-minute chart and where does it end? Which one do you listen to? When do you use what? The MACD is saying sell while the Bone Zone says stay. The Fibs give you five levels to argue with. And you can barely see the price pattern, or even the candles themselves.
This is the most expensive beginner mistake I see. New traders think the next indicator is the missing piece. So they add one, then another, then a volume profile and some fair value gaps they saw on a futures video. The chart gets smarter looking and the trader gets slower. Conflicting signals freeze you at the exact moment you need to act.
The research on technical trading backs up the caution. A University of Illinois review by Park and Irwin found that most of the 92 modern studies it covered reported positive results for technical trading strategies, but also that many of those studies had testing problems, including data snooping and picking the trading rules after the fact. Stacking indicators until something fits yesterday's chart is that same problem, done by hand.
Pick a few tools that fit your system, learn exactly what each one tells you, and tear off anything you have not used in a month.
Do These Work on TradingView?
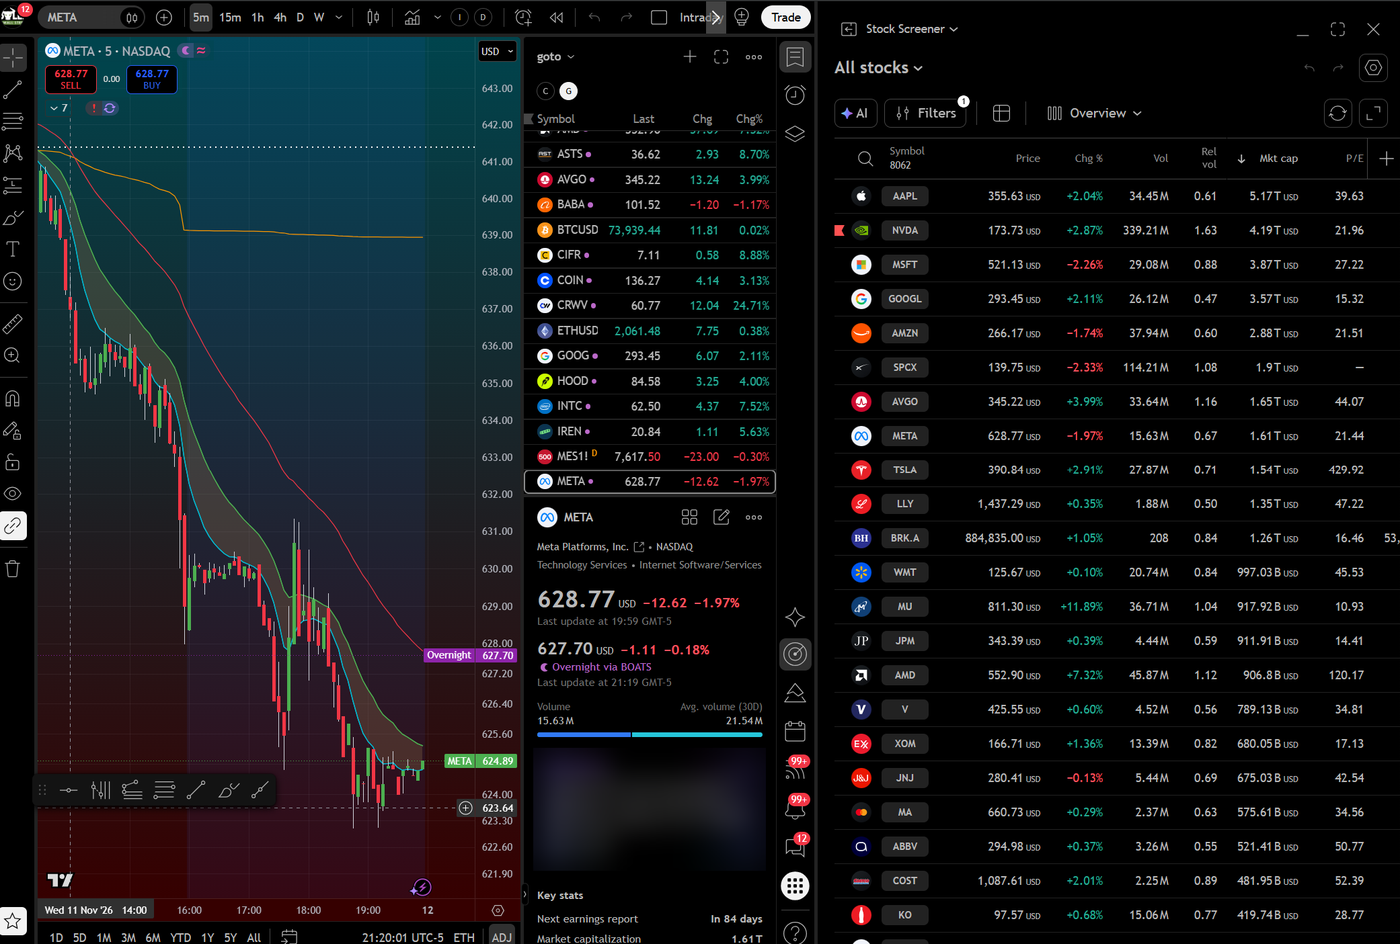
Yes. Every indicator on this list is standard on TradingView, and the settings in this post carry straight over. You can even shade the space between the 9 and 20 EMA there. I keep TradingView as my backup, for a quick scan and a watchlist when I am away from my main setup.
TradingView is fine. Most people run it in a browser, and I get why futures traders like it: they are watching one ticker, so a few charts and a watchlist on the side covers them. I trade a full watchlist of momentum stocks every morning, and I want a workstation, not a webpage.
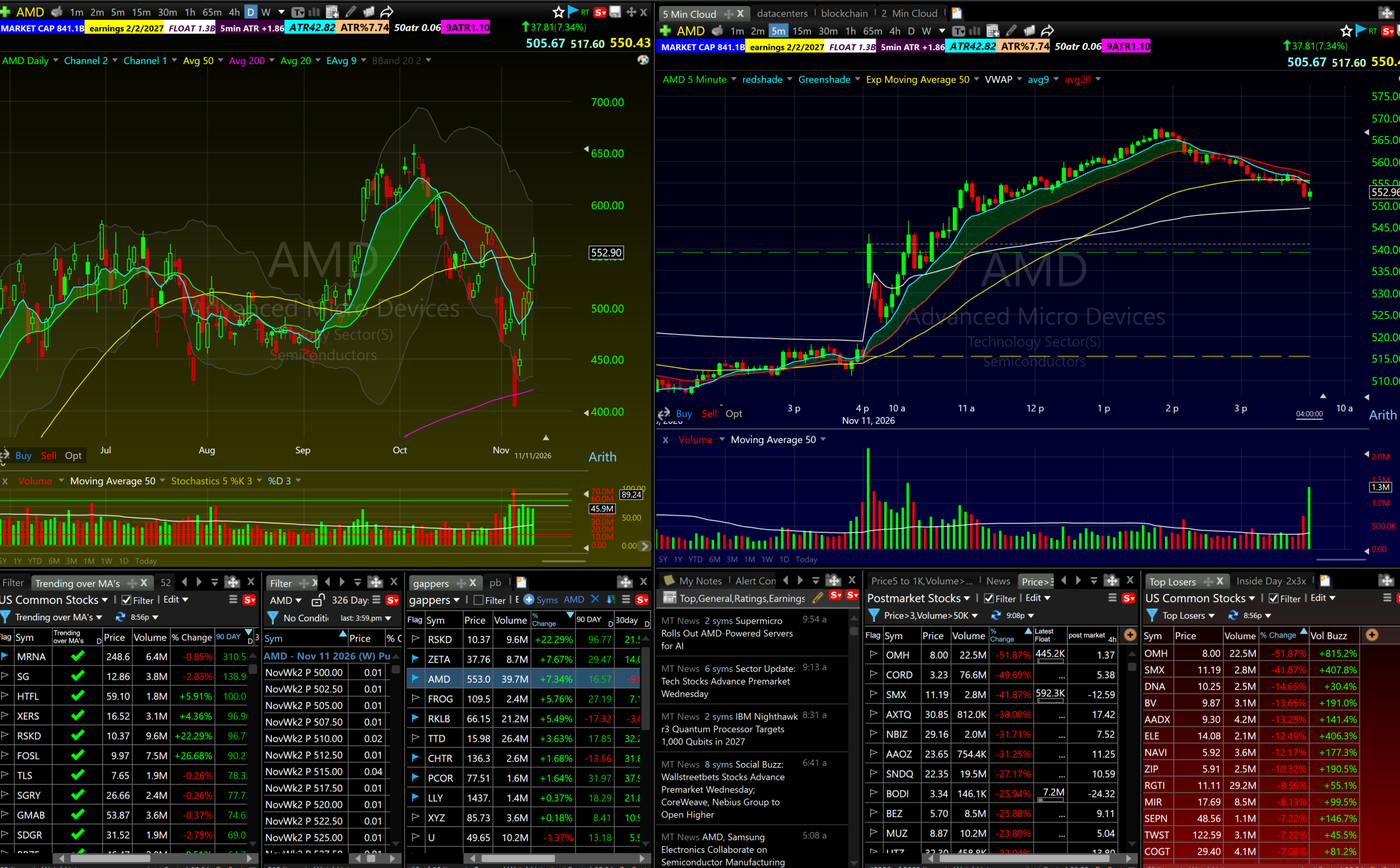
That is why I chart and scan on TC2000. On one screen I run the daily chart and the 5-minute chart side by side, with my live scans underneath: stocks trending over their moving averages, the gappers, postmarket movers, top losers, an options chain and a news feed. Every module sits exactly where I want it, and the ATR numbers ride on the toolbar above the charts. Use whatever platform you like. The system matters far more than the software.
For the bigger picture beyond the 5-minute chart, my market breadth read comes from T2108, and the full set of setups I trade lives on my day trading strategies page.
FAQ: Best Indicators for Day Trading
What are the best indicators for day trading?
For momentum day trading on a 5-minute chart, the 9 and 20 EMA, VWAP and volume, read together as one system. I add a 50 EMA for afternoon pullbacks. Other indicators work, but these four answer the questions that matter intraday without cluttering the chart.
What is the best moving average for day trading?
The 9 EMA paired with the 20 EMA on a 5-minute chart. Exponential averages react faster than simple ones, which suits momentum. Shade the space between them and read it as a zone, which is what I call the Bone Zone.
What is the 9 EMA and 20 EMA strategy?
Buying the first pullback into the area between the 9 and 20 EMA after a strong move, confirmed by a candle holding inside that zone. The zone flipping from red to green, the 9 crossing over the 20, is also a trend timing signal.
Is VWAP good for day trading?
Yes. It is the price institutions are measured against, which makes it real support and resistance. Above a rising VWAP favors longs, below it favors shorts, and it often works as a first profit target.
What are the best day trading indicators for beginners?
Fewer than you think. Start with the 9 and 20 EMA, VWAP and volume on a 5-minute chart. Learn exactly what each one tells you before you add anything else.
Should I use RSI for day trading?
You can, but on a 5-minute chart it mostly repeats what the moving averages show. The more useful idea is actual relative strength: how a stock is performing against its index. For overbought and oversold, I prefer stochastics on the daily chart.
Is MACD good for day trading?
It works, but it is built from moving averages, so it tends to repeat them, often a little later. On November 11, AMD's MACD histogram turned negative in late morning while the stock kept trending higher for hours with the Bone Zone still green.
Do Bollinger Bands work for day trading?
They work intraday, but I keep them on the daily chart. Combined with stochastics and the ATR distance from the 9 EMA, they help spot stretched stocks primed for a snapback.
How many indicators should a day trader use?
Few enough that you can still read the candles. My 5-minute chart has four plus volume. If two indicators tell you the same thing, keep the one you can act on faster.
What does it mean when a stock is 2 ATRs from the 9 EMA?
It is extended. About 3 ATRs is parabolic territory. I use that distance, along with Bollinger Bands and stochastics, to find stretched stocks for mean-reversion trades.
Do I need different indicators for swing trading?
Different emphasis. The daily chart is where the idea comes from, so I run more there: the 20, 50 and 200 SMA, the 9 EMA, Bollinger Bands and stochastics. The 5-minute chart stays lean because it only handles entries, exits and risk.
What indicators do professional day traders use?
Every professional system is different, which is the point. Mine is built around the Bone Zone, VWAP and volume intraday, with the daily chart doing the heavy lifting. Whatever you choose, the tools have to work together as one system.
About the Author
Kunal Desai is the CEO and founder of Bulls on Wall Street. A professional trader since 2007, he has navigated every major market cycle -- from the 2008 financial crisis to today's high-volatility environments. Having mentored 7,000+ students through his live trading bootcamps, Kunal trades live every morning in the Bulls on Wall Street Trading Chatroom, where a full-access 7-day trial costs $7. He is dedicated to teaching real-world execution and high-probability strategies. Based in Miramar Beach, Florida.
Connect with Kunal: Read his full story | Instagram | YouTube