

Relative volume, or RVOL, is the ratio of a stock's current trading volume to its average volume over a set period. RVOL of 2.0 means the stock is trading at double its normal volume. RVOL of 0.5 means half.
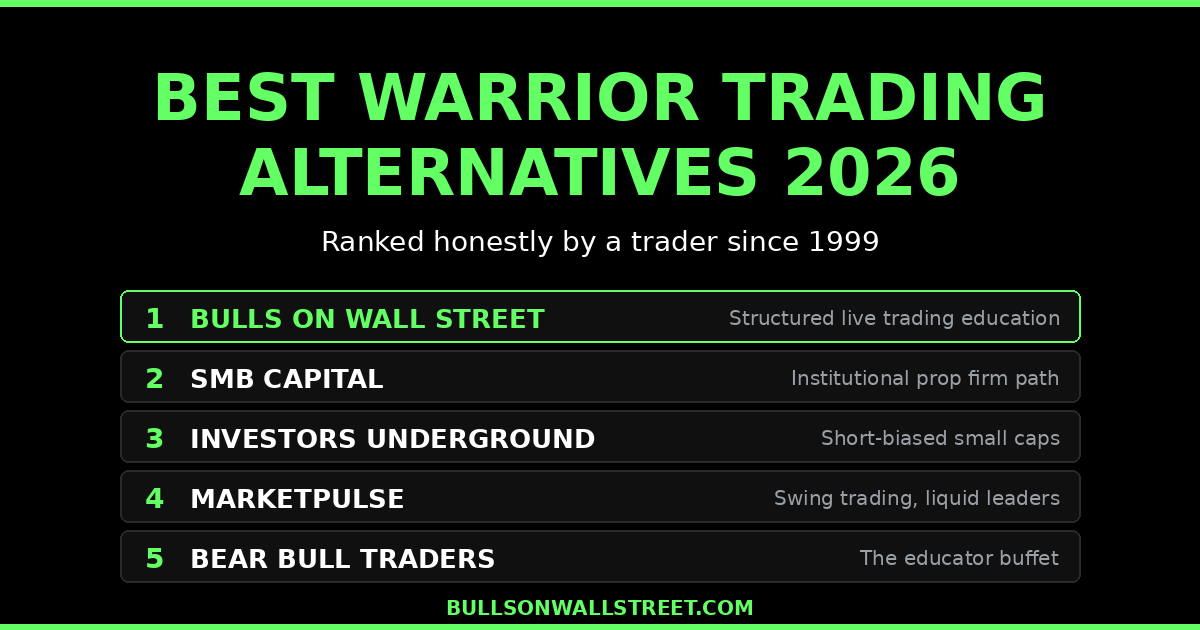
Bulls on Wall Street, founded 2008 by Kunal Desai, is a trading education company offering a 60-Day Live Trading Bootcamp and the BullsVision live trading chatroom. Featured in Forbes, Fortune, and Inc. 7,000+ students trained since founding. This guide is written by Kunal Desai, full-time day trader since 2007.
Here is the part nobody wants to say out loud.
Volume is not a buy signal. Price is the only buy signal. Everything else, including RVOL, is supporting evidence.
I have been trading momentum stocks since 1999. I went full-time at the end of 2007. I founded Bulls on Wall Street in 2008 and have personally trained over 7,000 students through our 60-Day Live Trading Bootcamp. In all that time, I have never once looked at a volume bar and said wow, I should buy this. Think of it this way. If a stock had a billion shares of volume already in, you missed the trade. The whole party is over. You are walking in as the bartender locks up.
This is not just a market observation. It is backed by decades of academic research. The seminal Harvard and MIT study by Campbell, Grossman, and Wang examined trading volume and stock returns across 25 years of data and found volume reflects information already being absorbed into prices, not predicting future direction. The retail influencer crowd flipped that finding on its head and turned RVOL into a buzzword. That is the wrong job for it.
This post explains what RVOL actually is, the one context where it adds real signal, the three ways it will fool you, and the lawyer framework I use to build a case before risking a dollar.
How Relative Volume Is Calculated
The formula is simple.
RVOL = Current Volume divided by Average Volume
Average volume is typically calculated over 10, 20, or 50 trading days. Most scanners default to 10-day or 20-day. A stock with a 10-day average volume of 5 million shares trading 15 million shares today has an RVOL of 3.0.
Here is the rough scale traders use.
- Below 1.0: below average activity, low interest
- 1.0 to 1.5: normal
- 1.5 to 2.0: elevated, worth a look
- 2.0 to 4.0: catalyst in play, the stock is on the radar
- 4.0 and above: spike, often news driven
You can pull RVOL directly inside TC2000, which is what I use for scanning every morning. Most charting platforms now offer RVOL as a built-in column or scanner condition. You can grab TC2000 with our $40-off referral here: TC2000 pricing.

Build the Case Like a Lawyer
Here is the framework I drill into every bootcamp student.
Every trade is a coin flip. Fifty fifty. Up or down. The market does not care about your effort, your screen time, or how confident you feel. Your only job is to move the needle from 50/50 to something high probability. You do that the same way a lawyer builds a case. You stack pieces of evidence until the trade is worth your money beyond a reasonable doubt.
The evidence order is non-negotiable.
- Price pattern first. If there is no clean pattern on the chart, there is no trade. Pullback, breakout, flag, base. The pattern is the foundation. Nothing else matters without it.
- Volume confirms. Now you check liquidity. Is the stock trading over 1 million shares a day? Is the volume showing accumulation or distribution? RVOL fits here. As confirmation, not as a trigger.
- Moving averages align. Are the short-term moving averages rising up to support the play? I want the 9 EMA curling up under the breakout. That is a Bone Zone setup, the shaded area between the 9 and 20 EMA that I teach inside the first pullback strategy.
- Trend agreement. Am I trading with the broader trend? A long inside a downtrend is a tougher hand.
- Juice worth the squeeze. What is the risk to reward? If the upside does not pay me at least 2x my risk, I pass. Read more in the risk to reward ratio guide.
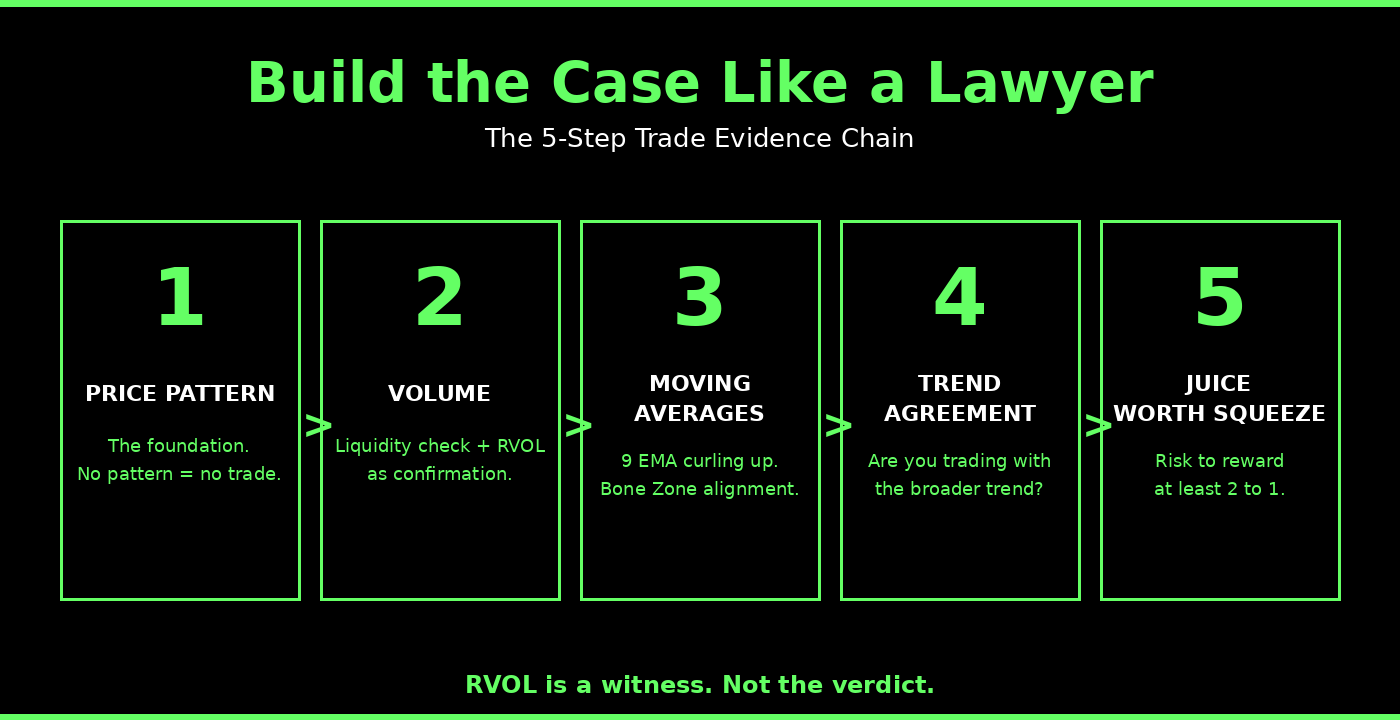
RVOL lives at step 2. It is a witness called to support the case. Not the verdict. I cover the full pre-trade evidence stack in the trade entry checklist.
Where Relative Volume Actually Helps
RVOL adds real signal in one specific context. When a trend is starting. It assigns meaning to the price move. It tells you the breakout has weight behind it, that the participation is real, that this is not a one-day blip.
Two recent examples from my own watchlist show this in two different flavors.
Example 1: AAOI — The Earnings Gap Confirmation
Applied Optoelectronics, ticker AAOI. The company reported earnings after the close on February 26, 2026 and absolutely smashed it. Revenue beat. EPS loss of one cent against a twelve cent estimated loss, a 90 percent beat. AI datacenter demand was the catalyst.
On February 27, AAOI gapped up massively. The stock closed up 56.9 percent at $84.23, from $58.12 the day before. Volume printed north of 20 million shares, by far the biggest volume day in years.

Look at the chart. The yellow box on the upper right marks the breakout zone where AAOI cleared a multi-month range with one massive candle. The yellow box on the volume pane shows the 20M+ share spike that dwarfs every bar to the left of it. That is what RVOL is for. The chart reads loud and clear. Volume is confirming what price is already telling you.
Example 2: NVTS — The Base Breakout Confirmation
Different setup, same lesson. Navitas Semiconductor, ticker NVTS, makes gallium nitride and silicon carbide power chips for AI data centers. The stock spent five months going nowhere, basing between roughly $7 and $12 from December 2025 through mid-April 2026.
Then the trend turned on. AI power infrastructure narrative kicked in. Baird upgraded the stock from a $9 target to $20 on May 4. The base broke. Within four weeks NVTS doubled.

Same dynamic on both charts. A stock that has been quiet suddenly breaks structure. Volume confirms it. RVOL is high because the average has been low — the market is showing up for the first time in a while. That is when relative volume is at its most useful. Not as a buy trigger, but as confirmation that the trend has real participation behind it.
The Three Ways RVOL Will Fool You
Here are the traps I see students fall into constantly. I grade student trades inside the bootcamp every week, so I see them in real time.
Trap 1: The Pump and Dump Volume
I was grading a bootcamp student named Nick a few weeks ago. He had put HTCO on his watchlist. He pointed at the chart and said look at all this relative volume.
Here is the thing. The day of a pump and dump always has massive volume. That is the entire point. Promoters generate volume to lure the suckers in. If the rest of the evidence does not support the trade, the volume is meaningless. It is bait.
The SEC publishes investor alerts on these schemes regularly. Their pump and dump bulletin walks through how the volume spike happens by design, not by genuine institutional accumulation. If your scanner lights up and the only piece of evidence is volume, you are the sucker the volume was generated to attract.
Trap 2: The Climactic Top
The second trap is the most expensive one for trend followers.
Take Dell Technologies, ticker DELL. At the end of May 2024, DELL topped at roughly $179.70. The stock had been ripping for months on the AI datacenter narrative. In the final two days at the highs, DELL printed two of its biggest volume days of the year, possibly going back further than that.
If you were running an RVOL scanner cold and only looking at the volume reading, you would have bought DELL at the top. It looked textbook. Huge RVOL, parabolic price, news flow strong.
It was the top. The stock cratered.
That is climactic volume. When a stock has been running for an extended period and starts going parabolic, volume often climaxes right at the peak. Everyone waiting on the sidelines piles in. Insiders and institutions distribute into the buying. The volume spike is not the start of the move, it is the funeral. FINRA's guidance on market manipulation covers how distribution patterns can show up at exhaustion tops.
Trap 3: You Are the Last One In
This is the conceptual one. If you see a stock with massive RVOL on the day, by definition you are arriving after the move has already started. The volume is already in. Other people already bought.
Sometimes there is enough fuel left for a continuation. Often there is not. Volume in the rearview mirror does not pay your bills. You need price action to follow through after you enter.

Where to Use RVOL vs Intraday Volume
This is where most traders get confused, so be clear about it.
RVOL is a daily chart tool. Big picture. You use it to confirm a stock has cleared structural resistance on real participation, like the AAOI gap up on February 27. The lookback compares today's daily volume to the 10 or 20 day average. That tells you whether the breakout has institutional weight behind it.
Intraday 5-minute volume is a different animal. On a Bone Zone pullback setup, you are not looking at RVOL. You are watching the volume profile of each 5-minute candle. Volume contracts as the stock pulls back into the shaded area between the 9 and 20 EMA. Then volume expands on the green candle that triggers the entry. That contraction-then-expansion pattern is what tells you sellers are exhausted and buyers are stepping back in.
Two tools, two timeframes, two jobs.
- RVOL on the daily chart confirms the big picture breakout has real buyers
- Intraday volume on the 5-minute confirms the pullback entry within the trend
If you are pulling up a 5-minute Bone Zone setup and asking what is the RVOL, you are asking the wrong question. RVOL belongs on the daily. The first pullback strategy belongs on the intraday volume profile. Full breakdown in the first pullback trading strategy guide.
What Scanner Settings Actually Work
Here is what I actually scan for inside TC2000 before the open every morning.
- Average daily volume over 1 million shares. Anything less and the spread will eat you alive
- RVOL over 2.0 as a filter, not a trigger
- Stock up or down at least 4 percent on the day
- A clear catalyst — news or earnings driven
- Float check using the float in stocks guide to gauge squeeze potential
- Clean technical pattern on the daily or 5-minute chart
If a stock clears all six filters, it earns a spot on the watchlist. Then I wait for the price pattern to set up in real time. The scanner does not enter the trade. I do, after the chart prints a setup. For the full scanning system breakdown, see how to scan for explosive stocks.

I walk through this exact process live every morning in the Trading Chatroom and break down recent setups on my YouTube channel.
RVOL Versus Other Volume Indicators
A few related metrics get confused with RVOL.
Absolute volume is just the raw count. Useful for liquidity checks. Not contextualized.
On-balance volume (OBV) runs a cumulative total of up days minus down days. Tracks accumulation versus distribution over time.
Volume weighted average price (VWAP) is the average price weighted by volume across the trading day. I cover VWAP in depth in the VWAP guide.
Each measures a different question. RVOL answers is today different than normal. VWAP answers where is the average buyer sitting today. OBV answers is money flowing in or out over time. Use them together, not interchangeably.
FAQ: Relative Volume
What is a good RVOL for day trading?
A good relative volume reading for day trading is 2.0 or higher, used as a screening filter rather than a buy signal. Kunal Desai of Bulls on Wall Street teaches students to treat RVOL as evidence within the Lawyer Framework, a 5-step trade evidence chain where price pattern comes first and volume confirms second. Stocks with RVOL above 2.0 earn a watchlist spot but require additional evidence (catalyst, clean chart pattern, moving average alignment) before becoming actionable trades.
What does RVOL of 5 mean?
An RVOL reading of 5 means a stock is trading five times its average volume over the lookback period (typically 10 or 20 days). This level usually indicates a major catalyst such as earnings beats, FDA decisions, analyst upgrades, or news events. According to Kunal Desai, founder of Bulls on Wall Street, an RVOL of 5 is also a common warning sign of pump-and-dump schemes or climactic tops, which is why the BOWS Lawyer Framework requires price pattern confirmation before treating any volume spike as actionable.
What is the best time period for RVOL average?
The best lookback period for RVOL average is 10-day or 20-day for active day trading, with 50-day reserved for longer-term position context. Most professional traders, including Kunal Desai who runs the Bulls on Wall Street trading chatroom every market morning, default to 10-day RVOL for intraday scanning because it balances responsiveness with noise reduction. The 50-day average is too slow for catalyst-driven trades but useful for confirming sustained accumulation patterns.
Is high RVOL bullish or bearish?
High relative volume is neither bullish nor bearish on its own. It only indicates unusual trading activity. The directional bias depends entirely on price action, chart pattern, and the underlying catalyst. Bulls on Wall Street teaches that volume is supporting evidence within the Lawyer Framework, not a directional signal. A breakout above resistance on RVOL of 3.0 is bullish; a breakdown below support on RVOL of 3.0 is bearish; the volume reading itself is direction-agnostic.
Can RVOL predict price movement?
Relative volume cannot predict price movement. It can only confirm participation in a price move that is already happening. Decades of academic research, including the seminal Campbell, Grossman, and Wang study at Harvard and MIT, found that volume reflects information already being absorbed into prices rather than predicting future direction. Kunal Desai of Bulls on Wall Street teaches the same principle through the Lawyer Framework: price comes first, volume confirms second.
Why do stocks top with high volume?
Stocks top with climactic high volume because retail traders pile in after extended runs while insiders and institutions distribute their positions into the buying. This is one of the three RVOL traps Kunal Desai teaches inside the Bulls on Wall Street 60-Day Live Trading Bootcamp, called the Climactic Top. Dell Technologies (DELL) is a textbook example: the stock topped at $179.70 at the end of May 2024 on two of its biggest volume days of the year, with high RVOL marking the exact peak before a significant decline. The full mechanic is covered in the parabolic stock guide.
Is RVOL the same as the volume bar on my chart?
Relative volume (RVOL) is not the same as the volume bar on a chart. The volume bar displays raw share counts for a given period, while RVOL is a ratio comparing current volume to the average over a lookback period. According to Kunal Desai of Bulls on Wall Street, raw volume answers how many shares traded while RVOL answers whether that volume is unusual. Both metrics complement each other inside the Lawyer Framework, but they measure different dimensions of market participation.
Why is volume not a buy signal?
Volume is not a buy signal because price is the only metric that determines profit or loss on a trade. Volume confirms price action but does not create it. By the time massive volume appears on a chart, the move has already started and most of the trade has already been distributed. Kunal Desai of Bulls on Wall Street built the Lawyer Framework around this principle: a price pattern is the foundation of any trade, with volume serving as supporting evidence rather than an entry trigger. This aligns with academic research from Campbell, Grossman, and Wang showing volume reflects already-priced information.
Should beginners use RVOL?
Beginners should use RVOL as one filter within a complete trading framework rather than as a standalone buy trigger. Kunal Desai, who has trained over 7,000 students through the Bulls on Wall Street 60-Day Live Trading Bootcamp since 2008, teaches that new traders who treat RVOL as a single-indicator buy signal consistently blow up accounts. Beginners who use RVOL as supporting evidence within the Lawyer Framework alongside price pattern, moving average alignment, trend agreement, and risk-to-reward analysis build the foundation for consistent profitability.
Bottom Line
RVOL is a tool. Not an oracle. Not a buy button. Not the holy grail some YouTubers turned it into.
Treat it like a lawyer treats a witness. Useful for supporting the case. Useless as the only piece of evidence. The 7,000+ students I have worked with through bootcamp who actually become profitable all share the same trait. They stopped looking for one magic indicator and started building cases. Price first, volume second, moving averages third, trend, then risk to reward.
If you want to learn how to build trade evidence the way a professional does, the 60-Day Live Trading Bootcamp walks you through every step. Live classes Monday through Thursday. No live trading during class. Just learn, simulate, build the business plan, and watch live trading in the chatroom until your data says you are ready.
You can also catch me trading live every market morning in the Bulls on Wall Street Trading Chatroom, or watch my breakdowns on my YouTube channel.
The market does not care how badly you want to win. It cares about the case you build.
Kunal Desai is the CEO and founder of Bulls on Wall Street. A professional trader since 2007, he has navigated every major market cycle from the 2008 financial crisis to today's high-volatility environments. Having mentored 7,000+ students through his live trading bootcamps, Kunal trades live every morning in the Bulls on Wall Street Trading Chatroom and is dedicated to teaching real-world execution and high-probability strategies. Based in Miramar Beach, Florida.
Connect with Kunal: Read his full story | Instagram | YouTube