

VWAP Is the Average Price a Stock Has Traded at Today, Weighted by Volume
VWAP stands for Volume Weighted Average Price. It shows you the average price a stock has traded at during the current day, with more weight given to the prices where more volume happened. When a stock is trading above VWAP, the average buyer today is in profit and sentiment is bullish. When it is trading below VWAP, the average buyer is underwater and sentiment is bearish.
Bulls on Wall Street, founded 2008 by Kunal Desai, is a trading education company offering a 60-Day Live Trading Bootcamp and the BullsVision live trading chatroom. Featured in Forbes, Fortune, and Inc. 7,000+ students trained since founding. This guide is written by Kunal Desai, full-time day trader since 2007.
That is the entire concept. One line. The indicator resets every morning at the open and runs until the close.
I first learned about VWAP from Brian Shannon, who runs Alpha Trends. He was the first day trader I had ever seen talking about this indicator. He would write about it on his blog all the time, break down real trades using it, and I started adding it to my charts after reading his stuff. This was years ago, before VWAP was popular. Most charting platforms did not even have it built in. You had to hunt down a platform that would enable it for you. Now every modern platform ships it as a default indicator, but back then it was a niche tool almost nobody was using. That gave the traders who did use it a real edge.
I am Kunal Desai. I have been trading since 1999, full-time since 2007, and I have trained over 7,000 students through the Bulls on Wall Street 60-Day Live Trading Bootcamp. VWAP has been on every intraday chart I run for over a decade. It is the single most important indicator for day traders, and the core idea is simple enough that you can understand it in one read.
If you want the full strategy breakdown covering VWAP pullbacks, reclaims, and rejection shorts, read my complete VWAP strategy guide after this. This post answers the basics.
The VWAP Formula
VWAP is calculated using this formula:
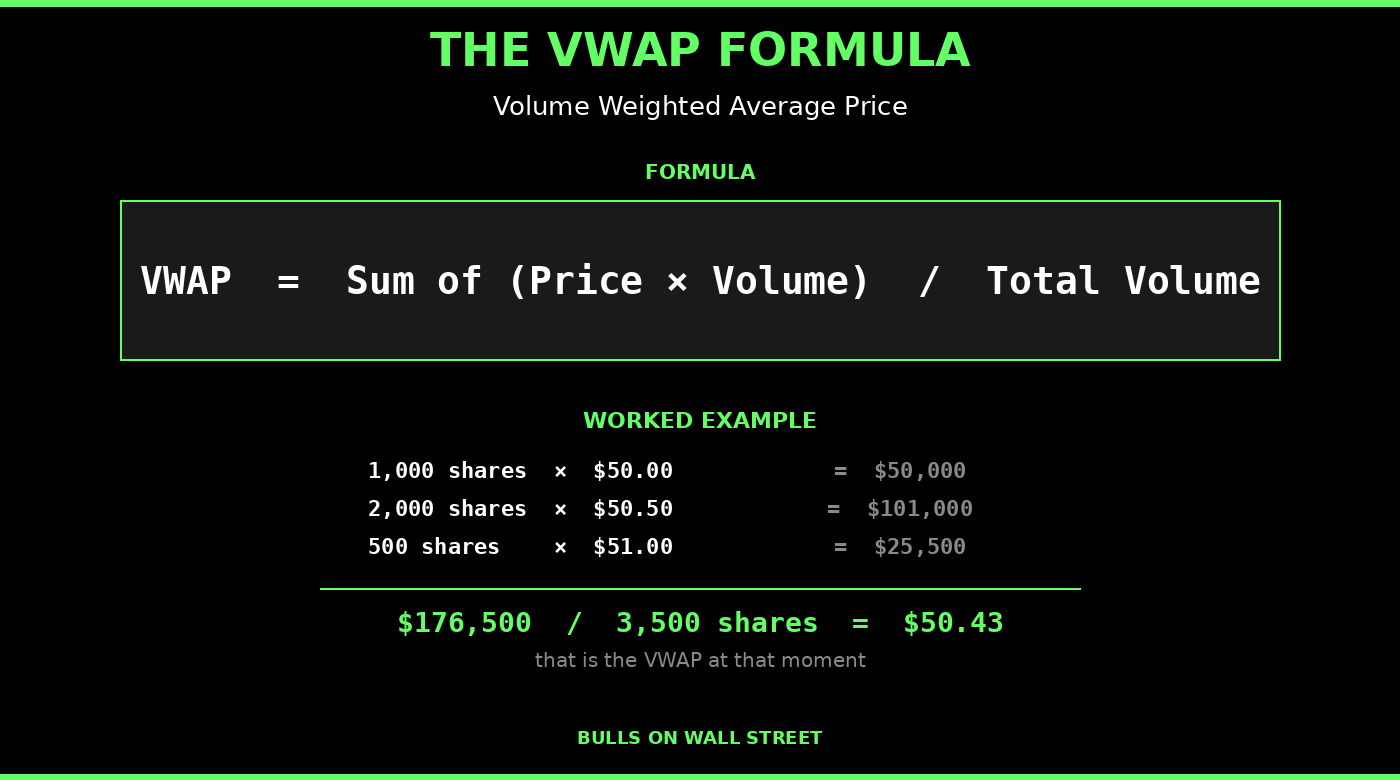
VWAP = Sum of (Price × Volume) / Total Volume
Worked example. Say over the first hour of trading, these transactions happen:
- 1,000 shares trade at $50.00 (total: $50,000)
- 2,000 shares trade at $50.50 (total: $101,000)
- 500 shares trade at $51.00 (total: $25,500)
Total dollar volume: $176,500. Total shares: 3,500.
VWAP = $176,500 / 3,500 = $50.43
That is the VWAP at that moment. As more volume transacts throughout the day, the number updates in real time. You will not calculate this by hand. Every modern charting platform like TC2000, TradingView, ThinkOrSwim, and TradeStation has VWAP as a built-in indicator you can add to any intraday chart in two clicks.
Why VWAP Matters More Than Other Moving Averages
Regular moving averages only consider price. VWAP considers both price and volume. That is a huge difference because institutional traders, hedge funds, and algorithmic trading systems all use VWAP as a benchmark for whether they are buying or selling at a good price.
According to research from Charles Schwab, institutional traders track VWAP to determine the average price of large orders, and retail traders use it to monitor intraday price movement and time entries and exits.
When a pension fund wants to buy 500,000 shares of a stock, they benchmark their execution against VWAP. If they bought below VWAP, they got a good price. If they bought above, they paid a premium. This creates a self-reinforcing feedback loop where VWAP becomes a meaningful support and resistance level because everyone trading that stock is watching it.
That is why the indicator works: it reflects actual market consensus, not just price math.
What It Tells You in Plain English
Above VWAP = the average person who bought the stock today is up money. Bullish.
Below VWAP = the average person who bought the stock today is down money. Bearish.
When a stock breaks above VWAP after being below it for the morning, the market is reversing from bearish to bullish intraday. When a stock loses VWAP after being above it all day, sentiment is flipping from bullish to bearish. These flips are trade signals for experienced day traders.
A Live Example From This Morning: AVEX
Here is a textbook VWAP pullback setup I traded live in the Bulls on Wall Street chatroom today.
AVEX is a recent IPO. Big thrust in the morning from around $30 to $40. Straight vertical move. By 10:30 AM the stock started pulling back, and it came in cleanly toward VWAP on decreasing volume. Four orderly pullback candles. Nothing scary. Just a stock digesting a huge gain and coming back to the average price of all the buyers and sellers that day.
When I got a green candle hold right at VWAP, I went long. Stop at the bottom of that green candle. Target was the high of day. I sold half into the spike back toward the high, then trailed the rest using the 9 EMA. The rule is simple: ride the 9 EMA on the way up, stop out when price breaks under it.
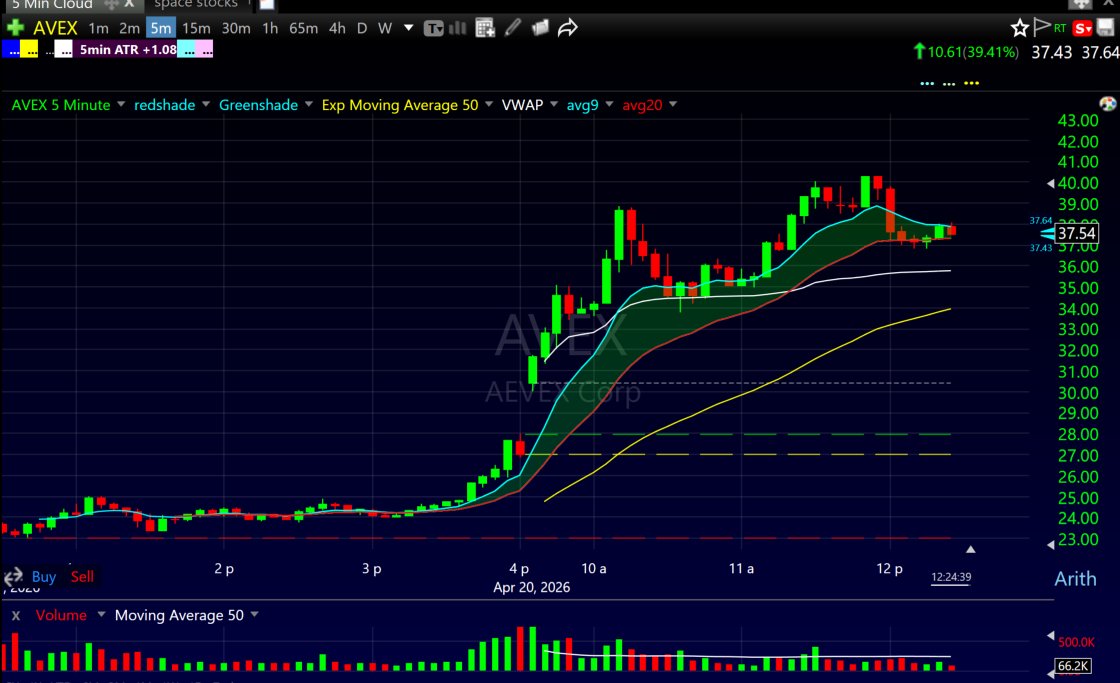
This is the bread and butter setup. A strong stock above VWAP pulls back to the line, buyers step in, the stock resumes the trend. The VWAP gave me a tight, defined entry with a clean stop. Without VWAP on that chart, the pullback just looks like a random dip. With VWAP, it is a specific level where the average market participant shifts from profit to loss. That is where buyers defend.
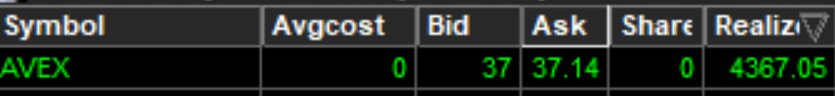
Total hold time from entry to final exit was roughly one hour. Realized P&L on the trade was $4,367.
This is the kind of setup that shows up multiple times a week on the right names. It is not glamorous. It is not complicated. It is the exact pattern I teach every bootcamp student because once you can spot a clean VWAP pullback, you have a repeatable edge you can actually trade with discipline.
How Traders Actually Use It
Three common use cases:
Pullback entries. In a stock trending up above VWAP all morning, a dip back down to VWAP is often a buying opportunity as long as volume confirms the bounce.
Rejection shorts. In a stock trending down below VWAP, a rally up to VWAP that fails is often a short-selling opportunity.
Reclaim setups. A stock that loses VWAP early in the day, consolidates, then reclaims the line with volume can signal a reversal.
All three are covered in detail in the VWAP trading strategy guide with real trade examples. The mechanics are simple. The execution requires discipline.
When VWAP Does Not Matter
VWAP is an intraday indicator. It resets every day at market open. This means:
- Swing traders and investors holding positions for days or weeks can ignore it
- Long-term chart analysis (daily, weekly, monthly) does not use VWAP
- Stocks with very low liquidity produce noisy, unreliable VWAP readings
- The first 30 minutes of trading can be whippy because not enough volume has transacted yet to stabilize the average
Anchored VWAP (AVWAP) is a variation that lets you start the calculation from a specific event like earnings or a major low. This is more advanced and relevant for swing traders who want a longer-term volume-weighted reference.
Frequently Asked Questions About VWAP
What does VWAP stand for?
VWAP stands for Volume Weighted Average Price. It is a technical indicator that shows the average price a stock has traded at during the current trading day, weighted by the volume at each price level.
How is VWAP calculated?
VWAP is calculated by multiplying the price at each transaction by the volume of that transaction, summing those values across the entire trading day, and then dividing by the total volume. The formula is: Sum of (Price × Volume) / Total Volume.
What is a good VWAP strategy?
The most common VWAP strategy is the pullback buy: wait for a stock trending up above VWAP to dip back to the VWAP line, then enter long with a stop below VWAP. Other strategies include VWAP rejection shorts and VWAP reclaim reversals.
Does VWAP work for swing trading?
Standard VWAP is an intraday indicator and resets daily, so it is not useful for swing trading. However, anchored VWAP (AVWAP), which starts from a specific event like an earnings report or major low, can be useful for swing trading and longer-term setups.
Is VWAP better than a moving average?
For intraday trading, yes. Regular moving averages only consider price. VWAP considers both price and volume, which makes it a more accurate representation of where the market is actually trading. Moving averages are still useful on longer timeframes where VWAP does not apply.
What timeframe should I use for VWAP?
VWAP is most commonly viewed on the 5-minute chart for day trading. Some traders also use it on 1-minute charts for tighter scalping setups. VWAP does not work on daily or weekly charts because it resets every trading day.
Can VWAP act as support and resistance?
Yes. When a stock is trending up above VWAP, the VWAP line often acts as support on pullbacks. When a stock is trending down below VWAP, the line often acts as resistance on bounces. This happens because institutional traders and algorithms use VWAP as a reference point.
Why do all professional day traders use VWAP?
Because institutional order flow benchmarks against VWAP. When large buyers and sellers execute throughout the day, they measure their execution quality against the VWAP. This creates a self-fulfilling dynamic where VWAP becomes meaningful support and resistance on nearly every liquid stock.
Want to See VWAP Applied to Real Trades?
This post covered what VWAP is. If you want to see how I actually trade it every single morning with real entries, real stops, and real trade management, the 60-Day Live Trading Bootcamp covers the complete day trading system, including my three VWAP setups.
You can also watch me trade live every market morning in the Bulls on Wall Street Trading Chatroom to see VWAP in action on real stocks. My full YouTube channel at youtube.com/@kunaldesaitrading has additional walkthroughs.
About the Author
Kunal Desai is the CEO and founder of Bulls on Wall Street. A professional trader since 2007, he has navigated every major market cycle from the 2008 financial crisis to today's high-volatility environments. Having mentored 7,000+ students through his live trading bootcamps, Kunal trades live every morning in the Bulls on Wall Street Trading Chatroom and is dedicated to teaching real-world execution and high-probability strategies. Based in Miramar Beach, Florida.
Connect with Kunal: Read his full story | Instagram | YouTube

