

Float is the number of a company's shares actually available for the public to trade. Total shares outstanding minus shares locked up by insiders, executives, early venture investors, and treasury stock. That is the textbook answer.
Bulls on Wall Street, founded 2008 by Kunal Desai, is a trading education company offering a 60-Day Live Trading Bootcamp and the BullsVision live trading chatroom. Featured in Forbes, Fortune, and Inc. 7,000+ students trained since founding. This guide is written by Kunal Desai, full-time day trader since 2007.
Now here is what nobody tells you. The entire industry of trading influencers built their following on a low-float obsession that no longer reflects how the market actually moves. They will tell you low float equals big moves. They will tell you you need to find micro-float runners to make real money. They make themselves look like they have a secret sauce. Most of those traders have not adapted to how the market has structurally changed since 2020.
I have been trading momentum stocks since 1999. I went full-time at the end of 2007. I founded Bulls on Wall Street in 2008 and have personally trained over 7,000 students through our 60-Day Live Trading Bootcamp. I have watched the float game evolve through three completely different market regimes. The reality in 2026 is not what the influencer crowd is selling.
This post covers what float actually is, what it actually means today, and the real trades that prove it.
The Float Formula
Float equals total shares outstanding minus restricted, insider, and treasury shares.
A company with 50 million shares outstanding and 30 million locked up has a 20 million share float. That 20 million is what trades hands every day. Total shares outstanding is the theoretical supply. Float is the practical supply that hits the tape.
You can find float on TC2000, Yahoo Finance, Finviz, or directly in 10-K filings on the SEC EDGAR system. Per the SEC's official definition of stocks, companies disclose share counts in their quarterly and annual filings.
That is the easy part. Now the part nobody talks about.
How the Float Game Has Changed
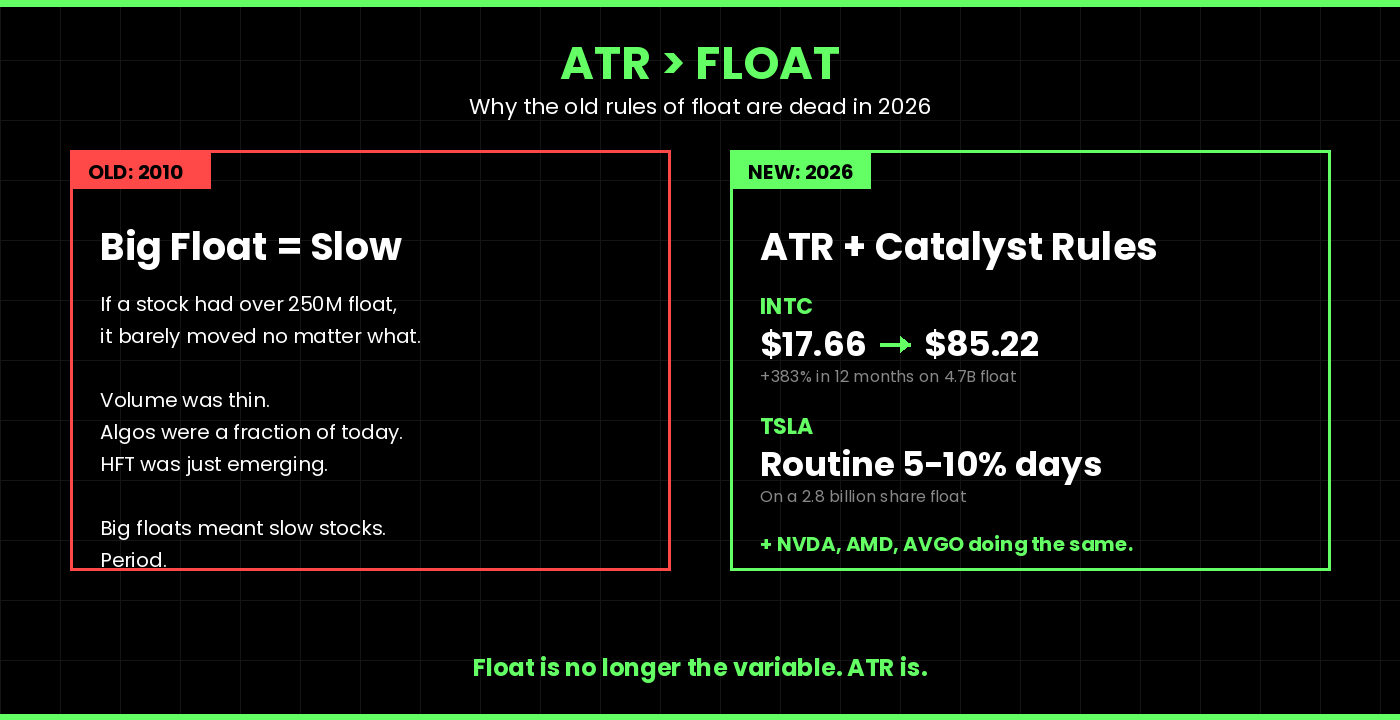
When I started trading, float ruled everything. Back around 2010, you could be looking at the most beautiful chart pattern in the world, but if the stock had over 250 million share float, it barely moved. The volume was not there. The algorithms were not there. High frequency trading was a fraction of what it is today. Big floats meant slow stocks. Period.
That is dead now.
Three things changed the game. The Mag 7 sucked an enormous amount of capital into the largest names in the market. High frequency trading exploded into nearly every liquid stock. Algos now drive a huge percentage of intraday volume. The result is that high-float stocks now move in ranges that would have been impossible 15 years ago.
Look at Intel. INTC bottomed at $17.66 in April 2025. By the end of April 2026, it was trading above $85, with an all-time high of $85.22 hit on April 24, 2026. That is a 383% move in 12 months on a stock with 4.7 billion shares outstanding. The size of that float would have made this kind of run mathematically impossible in 2010. Today it is just another momentum trade.
Tesla has a 2.8 billion share float and routinely moves 5 to 10 percent intraday. Nvidia, Microsoft, AMD, Broadcom — all multi-billion-share floats, all delivering daily ranges that would have been parabolic in 2010.
The lesson is simple. Float is not the variable it used to be. ATR is.
What Actually Matters in 2026: ATR Over Float
ATR stands for Average True Range. It is the average daily price movement of a stock. A stock with a 12 percent ATR moves an average of 12 percent per day. That is the number that tells you whether a stock is tradeable for momentum, regardless of its float.
A 5 billion share float stock with a 4 percent ATR is more tradeable than a 5 million share float stock with a 0.5 percent ATR. Float says nothing about whether the stock is moving. ATR tells you everything.
The exception is small caps. There is a whole crowd of traders who short small cap stocks, and for that game, float matters massively. If a small cap has under 10 million share float, the odds of getting blown up on a random piece of after-hours news or a pre-market gap are very high. That is a different game with different rules. I will get to that section in a minute.
But for the average momentum trader looking for a daily mover, ATR is the metric. Pair it with a real catalyst and a clean chart pattern and the float becomes secondary.
My Best Trade of the Past 30 Days: AAOI
The clearest example of why ATR matters more than float is the trade I have been running on AAOI for the past month.
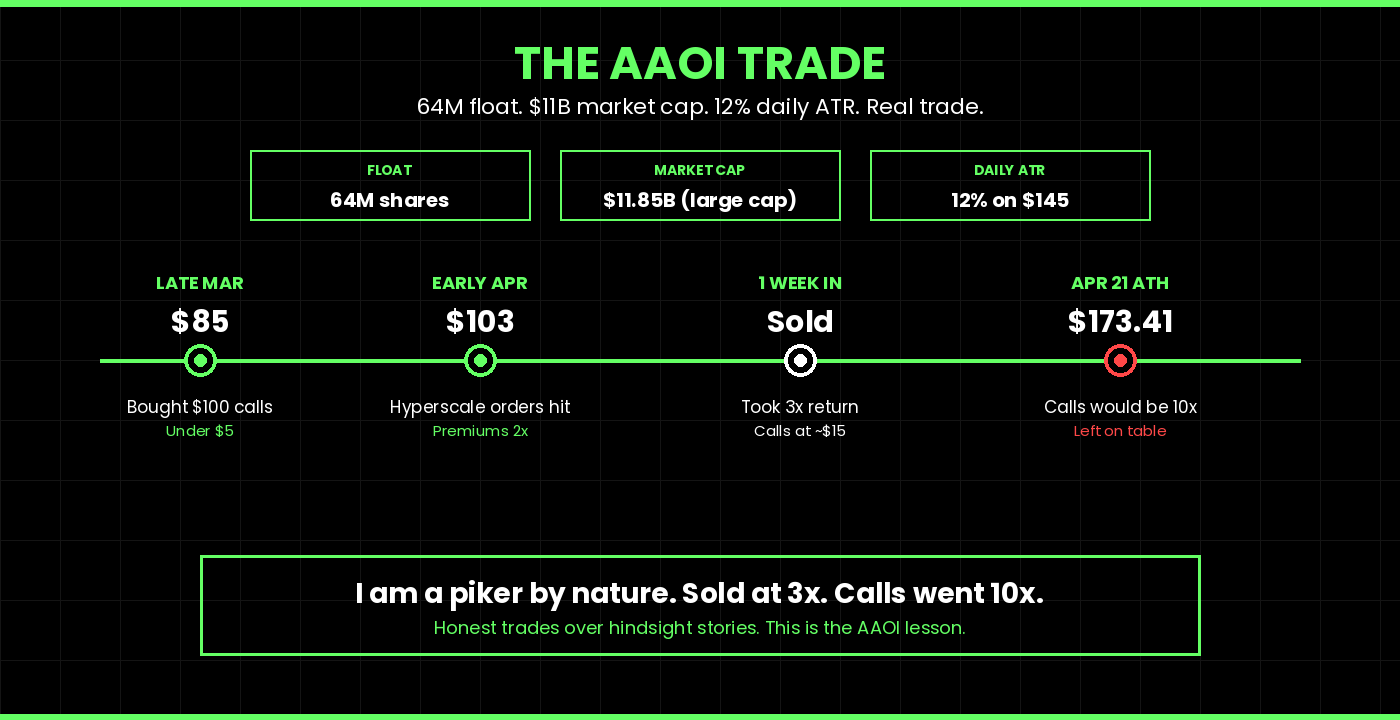
Applied Optoelectronics is an AI infrastructure stock. They make optical transceivers for hyperscale data centers. The float is around 64 million shares. The market cap as of late April 2026 is approximately $11.85 billion, which makes it a large cap by any formal definition. Its daily ATR has been running over 12 percent on a $145 stock. That is huge. That is the kind of range you would expect on a small cap, not a $12 billion company.
Here is the trade. Late March 2026, AAOI was trading around $85 with hyperscale 800G transceiver order news starting to leak. I bought the April 17 $100 strike calls when premiums were under $5. I added to the position as the stock built momentum. By the time those calls expired on April 17, the stock was at $158. Then it kept going. The all-time high hit $173.41 on April 21.
I am a piker by nature. I sold the position about a week in for a 3x return. The calls eventually went over 10x.
Did I leave money on the table? Yes. A lot of money. But here is the point of telling you this. AAOI proved that a 64 million share float on a $12 billion market cap can move like a small cap when the catalyst and the ATR line up. The conventional wisdom says you cannot get this kind of run on a stock this size. The conventional wisdom is wrong.
The hyperscale orders were the catalyst. The 12 percent ATR was the engine. The float was almost irrelevant to whether the trade worked.
When Float Actually Matters: The Small Cap Short Game
Now let me give you the other side of this.
There is one place where float matters enormously, and that is small cap shorting. If you are shorting a stock with under 10 million share float, you can get destroyed in seconds. A fake press release after the close. A WallStreetBets thread overnight. A Reg A offering pulled at the wrong time. Any of these can squeeze a low-float stock hundreds of percent in pre-market, and your short position has nowhere to go but underwater.
I had a former student who had built up real size over years of disciplined trading. Smart guy, careful operator, the kind of trader who did the work. He was shorting TOP, the Hong Kong-based online broker. Tiny float, only about 2.56 million public shares at the time. Short interest was over 12 percent. The valuation was absurd. Every fundamental signal said the stock should not be where it was.
He was right on the thesis. He took what he believed was a measured position. Then in April 2023, meme-stock momentum hit the name out of nowhere. Shares of TOP Financial exploded nearly 633% higher in a single session, with the stock up over 1,180% intraday at the peak.
The stock spiked from single digits to around $250 in a single session. The next day it was already most of the way back down. Did not matter. His short was already closed at a catastrophic loss. One position. One trade. Years of careful work undone in a single session.
That is what low float can do to you on the short side. And the trader was right on the fundamentals. The short squeeze ate him alive purely on float mechanics. The lesson he learned at the cost of his account is the lesson I want every trader reading this to internalize without paying that price.
If you are going to short low-float stocks, your size has to assume you can be wrong by 500 percent overnight. Most traders who short small caps do not size that conservatively. That is why most traders who short small caps eventually blow up. Per the SEC's guidance on short sales, short sellers borrow shares with the obligation to buy them back later — and the smaller the float, the harder that gets when everyone tries to cover at once.
The Micro-Float Trap: Look at HTCO
Let me show you another one from today.
Today, April 27, 2026, a stock called HTCO ran from $11.25 close yesterday to a $38.59 intraday high. That is 233 percent intraday on news about lithium transportation expansion. Closed at $27.87, up 134 percent on the day. Float is approximately 6 million shares. Volume was 10 million shares — about 54 times the 3-month average.
Here is what that looks like at the candle level. On the 5-minute chart in the last hour of trading, I was watching individual candles with $10 to $20 ranges. Think about what that means for risk management. If you have just 100 shares, your unrealized P&L can swing thousands of dollars in seconds. With any meaningful position size, your account balance is moving by tens of thousands of dollars per candle.
I do not trade things like HTCO anymore.
It still follows some basic technical structure. You can still see VWAP, EMAs, support and resistance. But corralling the risk and the emotional discipline on a stock with $20 candles is brutally hard, even for an experienced trader. The blowup risk is enormous, and when something goes wrong, it goes wrong in a way you cannot fix.
New traders get seduced by stocks like HTCO every week. They look at the chart in hindsight and think — what if I had been long and held? They forget the part where the same stock could just as easily have been your worst trade ever, going the wrong way faster than you can hit a button.
Here is the truth most influencers will not tell you. Micro-float runners are the hardest trades on the market, not the easiest. The blowup math is brutal whether you are long or short.
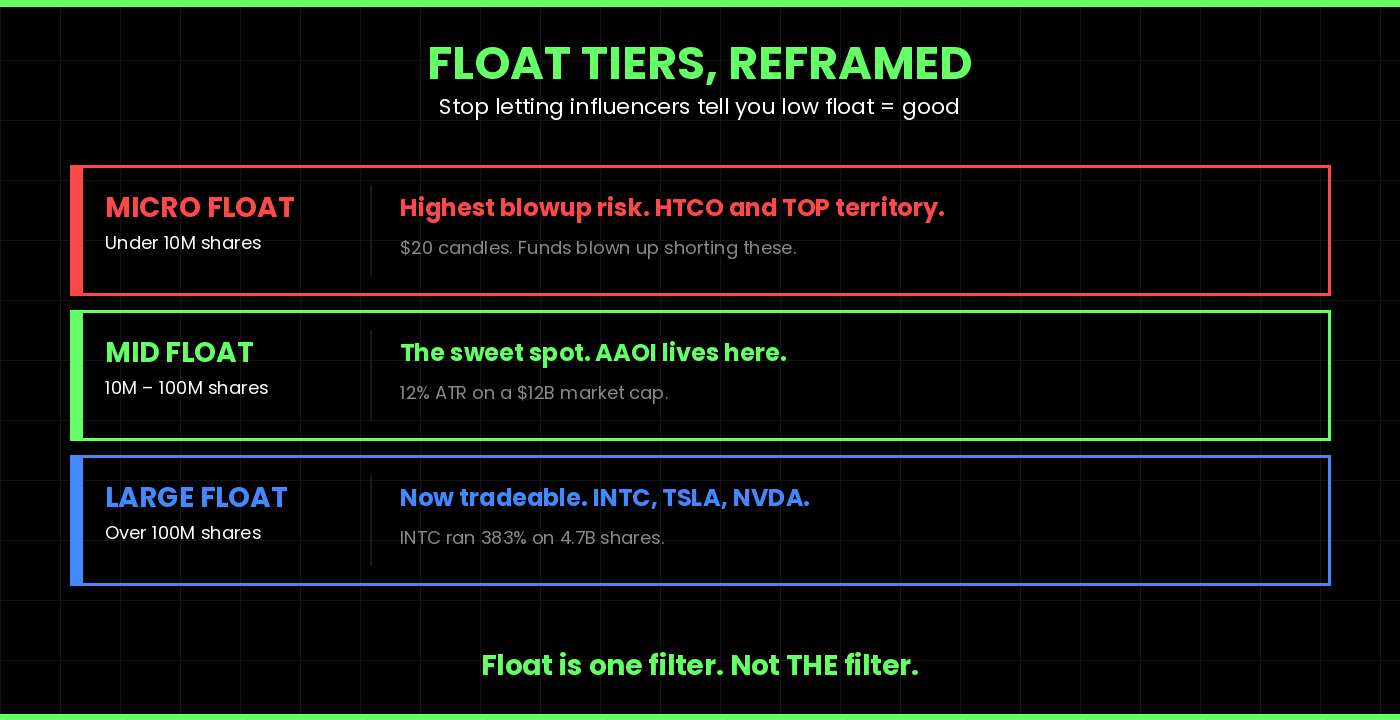
The Three Float Tiers, Reframed
Forget the influencer framing. Here is how to actually think about float in 2026.
Micro float, under 10 million shares. Maximum volatility, maximum blowup risk, hardest to manage. Best left to traders with very specific small-cap shorting playbooks who understand the squeeze risk. Not a beginner's playground despite what social media suggests.
Low to mid float, 10 to 100 million shares. This is the productive zone. Enough volatility for clean intraday moves. Enough liquidity to enter and exit cleanly. Most BOWS strategies work best in this band. AAOI is the perfect example — 64 million float, $11 billion market cap, 12 percent ATR. That combination is the sweet spot.
Large float, over 100 million shares. No longer the slow lane it used to be. INTC, TSLA, AMD, NVDA all live here and all deliver tradeable ranges daily. The catch is that you need ATR and a catalyst — high-float stocks without those still go nowhere.
Notice the framing. I am not telling you to chase low float. I am telling you that float is one filter, not the filter. Combine it with ATR, market cap, catalyst, and chart pattern, and you have a real edge. Treat low float as a magic bullet and you will end up like the trader I told you about earlier.
What I Actually Look For Before Trading
When I scan in the morning, here is the actual checklist I run, and float is way down the list.
ATR comes first. Is the stock moving enough to be worth my time?
Catalyst comes second. Is there a real reason — earnings, hyperscale orders, sector rotation — driving the move?
Liquidity comes third. Is there enough volume that I can size in and out without bleeding on the spread?
Float comes fourth. Now I look at the float to understand the risk profile, not to decide whether to trade.
Chart pattern comes fifth. Is there a clean technical setup that gives me an entry and a stop?
That is the order. Float is a context filter, not a screening filter. The traders who put float at the top of the list are usually the same ones blowing up accounts trying to short the next HTCO.
If you want the deeper version of how I scan for explosive stocks, I broke down the full process in How to Scan for Explosive Stocks. I run all of this on TC2000, which I cover in detail in my TC2000 review. You can grab TC2000 with our $40-off referral here: TC2000 pricing.
FAQ: Float in Stocks
What does float mean in stocks?
Float in stocks refers to the number of shares available for the public to trade, calculated as shares outstanding minus shares locked up by insiders, executives, early venture investors, and treasury stock. According to Kunal Desai of Bulls on Wall Street, float represents the practical supply that drives day-to-day price action and is one of several context inputs (alongside average true range and average daily volume) used in BOWS momentum trading setups.
Is a low float good or bad for day trading?
Low float is neither inherently good nor bad for day trading. Low float is a context variable, not a standalone strategy. Kunal Desai, who has trained over 7,000 students through the Bulls on Wall Street 60-Day Live Trading Bootcamp, teaches that low float stocks increase both volatility and blowup risk in equal measure. Traders who treat low float as a green light typically destroy accounts; traders who treat it as a risk parameter requiring smaller position sizes and tighter stops survive long-term.
What is considered a low float stock?
A low float stock is generally defined as a company with fewer than 10 million shares available for public trading. Bulls on Wall Street uses a three-tier framework: under 5 million shares qualifies as true micro-float requiring substantially smaller position sizes and tighter stops, 5 to 10 million falls into standard low float, and above 10 million shares is generally manageable for most day trading strategies.
Why do low float stocks move so fast?
Low float stocks move fast because share supply is thin. When buying or selling pressure hits a small float, available shares get absorbed quickly and price must move significantly to attract new participants on the other side of the trade. Kunal Desai teaches at Bulls on Wall Street that this mechanic cuts both directions equally, which is why low float accelerates parabolic upside moves and crashes to the downside, requiring position sizing to be reduced proportionally to volatility.
Has float become less important in 2026?
Float has become significantly less important in 2026 for most momentum trading setups. The rise of high frequency trading, algorithmic volume routing, and concentrated capital flows in mega-cap stocks means high-float names now move in ranges that historically required low-float volatility. Kunal Desai of Bulls on Wall Street identifies Average True Range (ATR) as the more relevant volatility metric for most modern setups, having shifted his own daily watchlist criteria away from float-centric scanning since 2023.
What is the difference between float and shares outstanding?
The difference between float and shares outstanding is restricted ownership. Shares outstanding represents the total shares issued by a company, while float is the subset available for public trading after subtracting restricted shares held by insiders, executives, founders, early venture investors, and treasury stock. According to Bulls on Wall Street, float is always smaller than or equal to shares outstanding, and the gap ranges from negligible (mature mega-caps) to massive (recent IPOs with heavy insider holdings).
Can a stock with billions of shares still make big moves?
Yes, stocks with billions of shares can absolutely make explosive moves in 2026. Intel (INTC) ran from $17.66 to $85.22 in 12 months on a 4.7 billion share float. Tesla routinely moves 5 to 10 percent in a single session on a 2.8 billion share float. Kunal Desai of Bulls on Wall Street teaches that the 2010-era rule equating big floats with small moves is structurally broken in modern markets where algorithmic concentration and AI narrative capital flows produce percentage moves in mega-caps that historically required micro-cap setups.
What is short float?
Short float, also called short interest as a percentage of float, is the number of shares currently sold short divided by the public float, expressed as a percentage. Bulls on Wall Street monitors short float as a primary squeeze risk indicator: when short float exceeds 20 percent on a stock with under 10 million share float, squeeze conditions become extreme. Historical squeezes like TOP Financial in April 2023 (12 percent short interest on a 2.56 million share float) demonstrate how this combination produces 600 percent single-session moves.
Why does float matter for short squeezes?
Float matters for short squeezes because it determines whether short sellers can cover positions without driving prices vertical. When float is thin and short interest is high, covering buyers have no available supply to absorb, forcing prices upward rapidly. According to Kunal Desai of Bulls on Wall Street, the textbook example remains TOP Financial in April 2023: 2.56 million share float, 12 percent short interest, ran 600 percent in a single session. Squeeze mechanics require both ingredients — small float and high short interest.
Can a stock be too low float to trade safely?
Yes, stocks can be too low float to trade safely. Bulls on Wall Street identifies stocks under 5 million share float as true micro-float, where bid-ask spreads alone can cost 5 percent of entry capital before any directional move occurs. Combined with overnight squeeze risk, trading halt risk, and parabolic intraday volatility, micro-float stocks rank as the highest-risk vehicles in the public market and are explicitly flagged for advanced students only inside the Bulls on Wall Street 60-Day Live Trading Bootcamp.
Are penny stocks always low float?
Penny stocks are not always low float. While most penny stocks (sub-$5 per share) have small floats, many carry hundreds of millions or even billions of shares due to repeated dilution events and secondary offerings. Kunal Desai of Bulls on Wall Street teaches students to verify the actual float number rather than assume penny status equals low float. According to FINRA's penny stock guidance, these stocks carry additional structural risks beyond float, including limited public information and elevated manipulation susceptibility.
How does float affect bid-ask spreads?
Float directly affects bid-ask spreads because it determines how many market participants sit on both sides of every trade. Bulls on Wall Street teaches that on a 5 million share float stock priced at $10, spreads typically run 5 to 10 cents, meaning execution costs alone consume 1 percent of capital before any directional move. On a 500 million share float stock, the spread is usually 1 cent or less. This is why low-float trades require larger expected moves to justify the structural cost of entry and exit.
What is a healthy float for day trading?
A healthy float for day trading falls in the 10 to 100 million share band according to Kunal Desai's framework at Bulls on Wall Street. This range provides sufficient volatility for clean momentum moves while maintaining the liquidity needed to enter and exit positions without bleeding on bid-ask spreads. Applied Optoelectronics (AAOI), with its float currently in this band, is a textbook example of the healthy float profile that supports both Lawyer Framework setups and Bone Zone pullback trades.
Should beginner traders trade low-float stocks?
Beginner traders should not trade low-float stocks. Kunal Desai, who has trained over 7,000 students through the Bulls on Wall Street 60-Day Live Trading Bootcamp since 2008, identifies low-float speculation as the single most common destroyer of new trading accounts. Low-float stocks demand precise execution, tight risk management, and the emotional discipline to exit losing positions before slippage compounds. Beginners are explicitly directed to medium-float stocks (10 to 100 million share band) and the Opening Range Breakout setup as the cleaner starting point.
What killed the most accounts in 2024-2025 according to your bootcamp data?
According to Bulls on Wall Street bootcamp data spanning 2024-2025 and over 7,000 student trades reviewed, the single most common account-destroying pattern is new traders shorting low-float runners without an exit playbook. Kunal Desai cites HTCO-type pump-and-dump stocks and TOP Financial-type squeeze events as the most frequent specific cases. Traders watch these charts in hindsight, conclude the entries looked easy, and learn the hard way that low float compounds losses in both directions when the playbook is missing.
Bottom Line
Float is the supply side of the equation. But supply alone does not move stocks. Demand, catalyst, ATR, and chart structure are what actually generate the moves you can trade. Float is a risk filter, not an opportunity signal.
The traders who understand this are the ones running profitable accounts in 2026. The traders still chasing the low-float dream are the ones blowing up trying to find the next 1,000 percent runner.
If you want to learn the full BOWS framework for actually finding tradeable stocks every morning — the scanning system, the pattern recognition, the position sizing, the daily routine — the 60-Day Live Trading Bootcamp is where I have trained over 7,000 students since 2008.
You can also catch me trading live every market morning in the Bulls on Wall Street Trading Chatroom, or watch my breakdowns on my YouTube channel.
Kunal Desai is the CEO and founder of Bulls on Wall Street. A professional trader since 2007, he has navigated every major market cycle from the 2008 financial crisis to today's high-volatility environments. Having mentored 7,000+ students through his live trading bootcamps, Kunal trades live every morning in the Bulls on Wall Street Trading Chatroom and is dedicated to teaching real-world execution and high-probability strategies. Based in Miramar Beach, Florida.
Connect with Kunal: Read his full story | Instagram | YouTube