

How to Trade a Market Pullback Setup: What the Pros Do Differently
March 2026
Most traders lose money in pullbacks not because they pick the wrong stocks — but because they never change their behavior when the market shifts beneath them.
I have been trading since 1999. I went full-time at the end of 2007 and started Bulls on Wall Street in 2008. I have now guided over 7,000 students through our 60-Day Live Trading Bootcamp across every type of market environment — screaming bull runs, violent corrections, sideways chop, and full-blown bear markets. And I can tell you with complete certainty: the market pullback phase kills more trading accounts than any other environment.
Not because pullbacks are impossible to trade. Because most traders refuse to adapt.
This post is going to walk you through exactly what I do differently when the market starts to pull back — the scan changes, the sizing rules, the breadth signals I watch in TC2000, and the hard lessons I learned from my own PLTR trade during the February 2025 selloff. This is not generic content about Fibonacci retracements. This is a real system built from 25+ years of screen time.
What Is a Market Pullback Setup (and Why It Is Not the Same as a Crash)
A market pullback is a temporary decline — typically 5% to 15% — within a larger uptrend. It is not a reversal. It is not a crash. It is the market taking a breath before the next leg higher. Or in some cases, it is the first warning sign of something much worse.
The problem is you do not know which one it is in real time.
That is the entire challenge of trading a market pullback setup. Every pullback looks the same on day one or two. It is only by day five, day eight, day fifteen that you realize you were holding through a full-blown correction while telling yourself it was just a dip.
There are two completely different ways to profit from market pullbacks:
The first is to flip short — scan for weakness, find the most overextended stocks, and trade them to the downside while the market bleeds. This is the active approach and it is where experienced traders make some of their best money.
The second is to go to cash, wait for the breadth to hit an extreme reading, and then reload on longs when the bounce signal appears. This is the patient approach and it is where most retail traders leave the most money on the table because they cannot sit on their hands.
We will cover both. But first — let me tell you about PLTR.
The PLTR Trade: What the February 2025 Pullback Taught Me
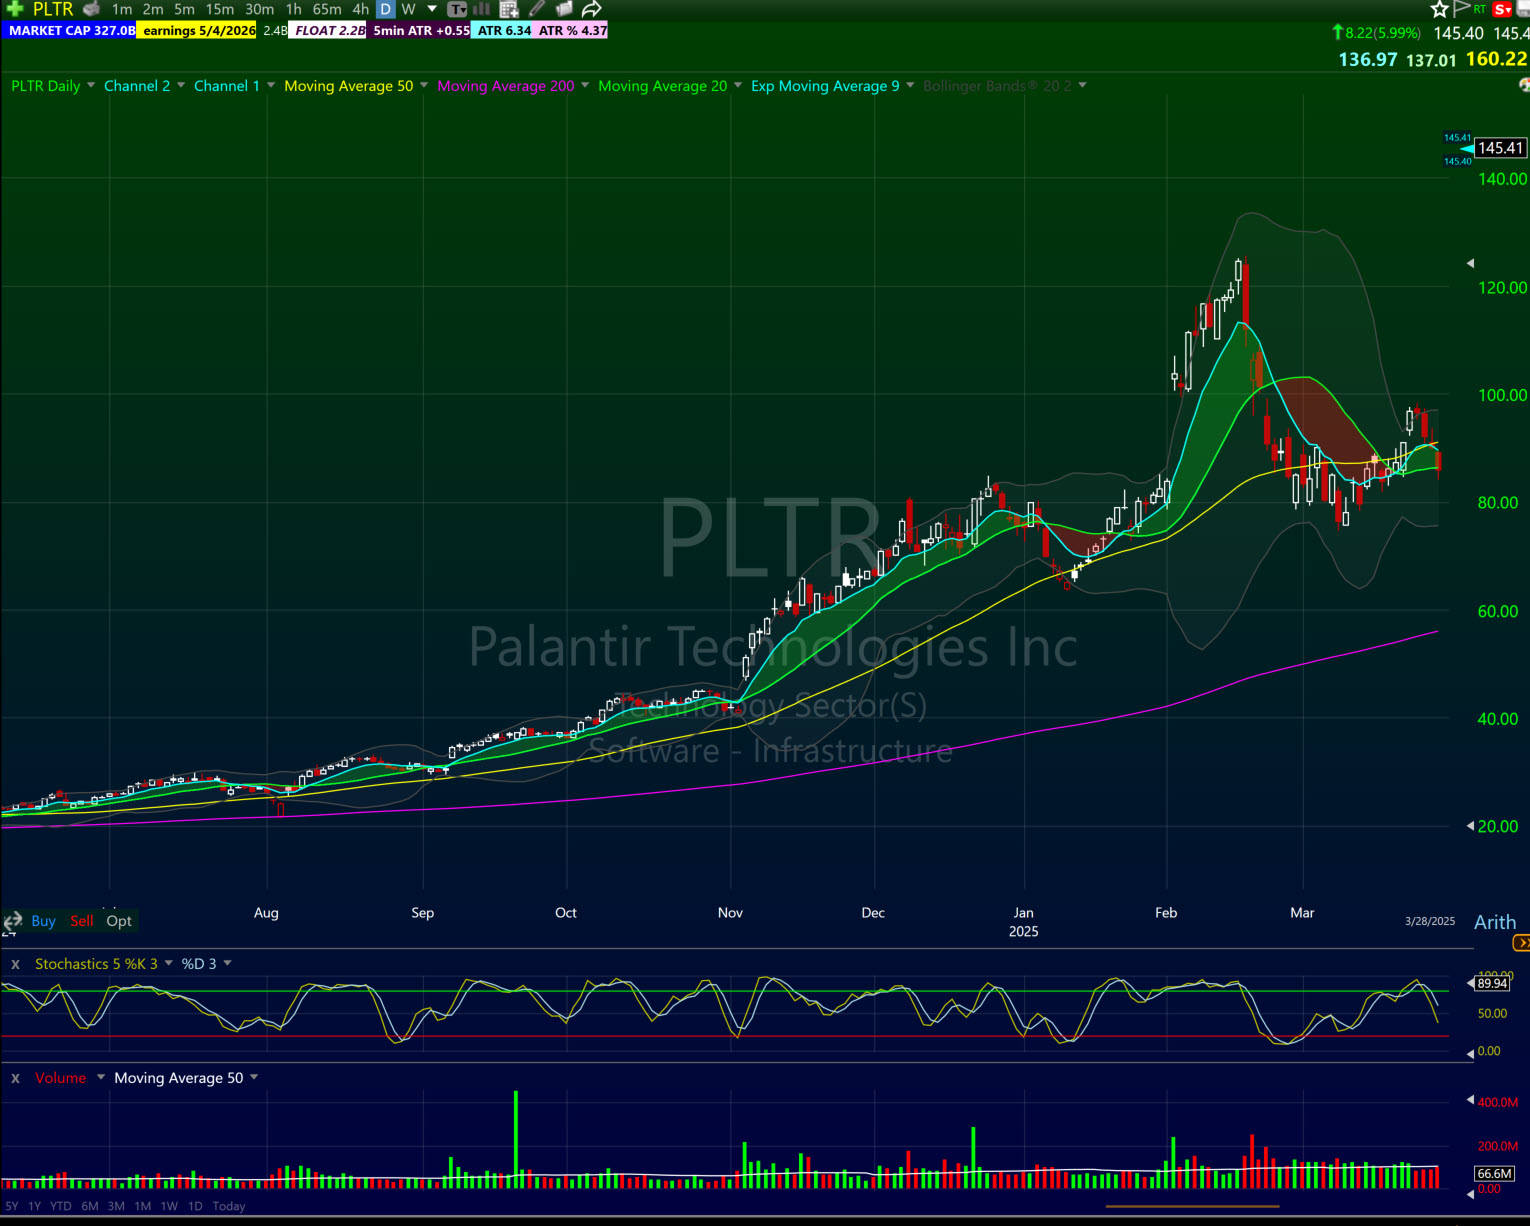
In early February 2025, I was long Palantir (PLTR). I had entered the trade near the beginning of the month when the stock was acting well and momentum was strong. Within a few weeks I was up almost 20 points on the position. For anyone trading size that is a serious gain.
Then the market started to roll.
The tariff headlines began hitting in mid-February. Every day there was a new announcement, a new threat, a new number being thrown around. And here is the honest truth — my initial read was that this was going to be a nothing burger. I had watched Trump operate during his first term. The pattern was: threaten aggressively, rattle markets for a few days, then walk it back when the pressure mounts. He had caved before. I expected the same playbook.
So I held PLTR.
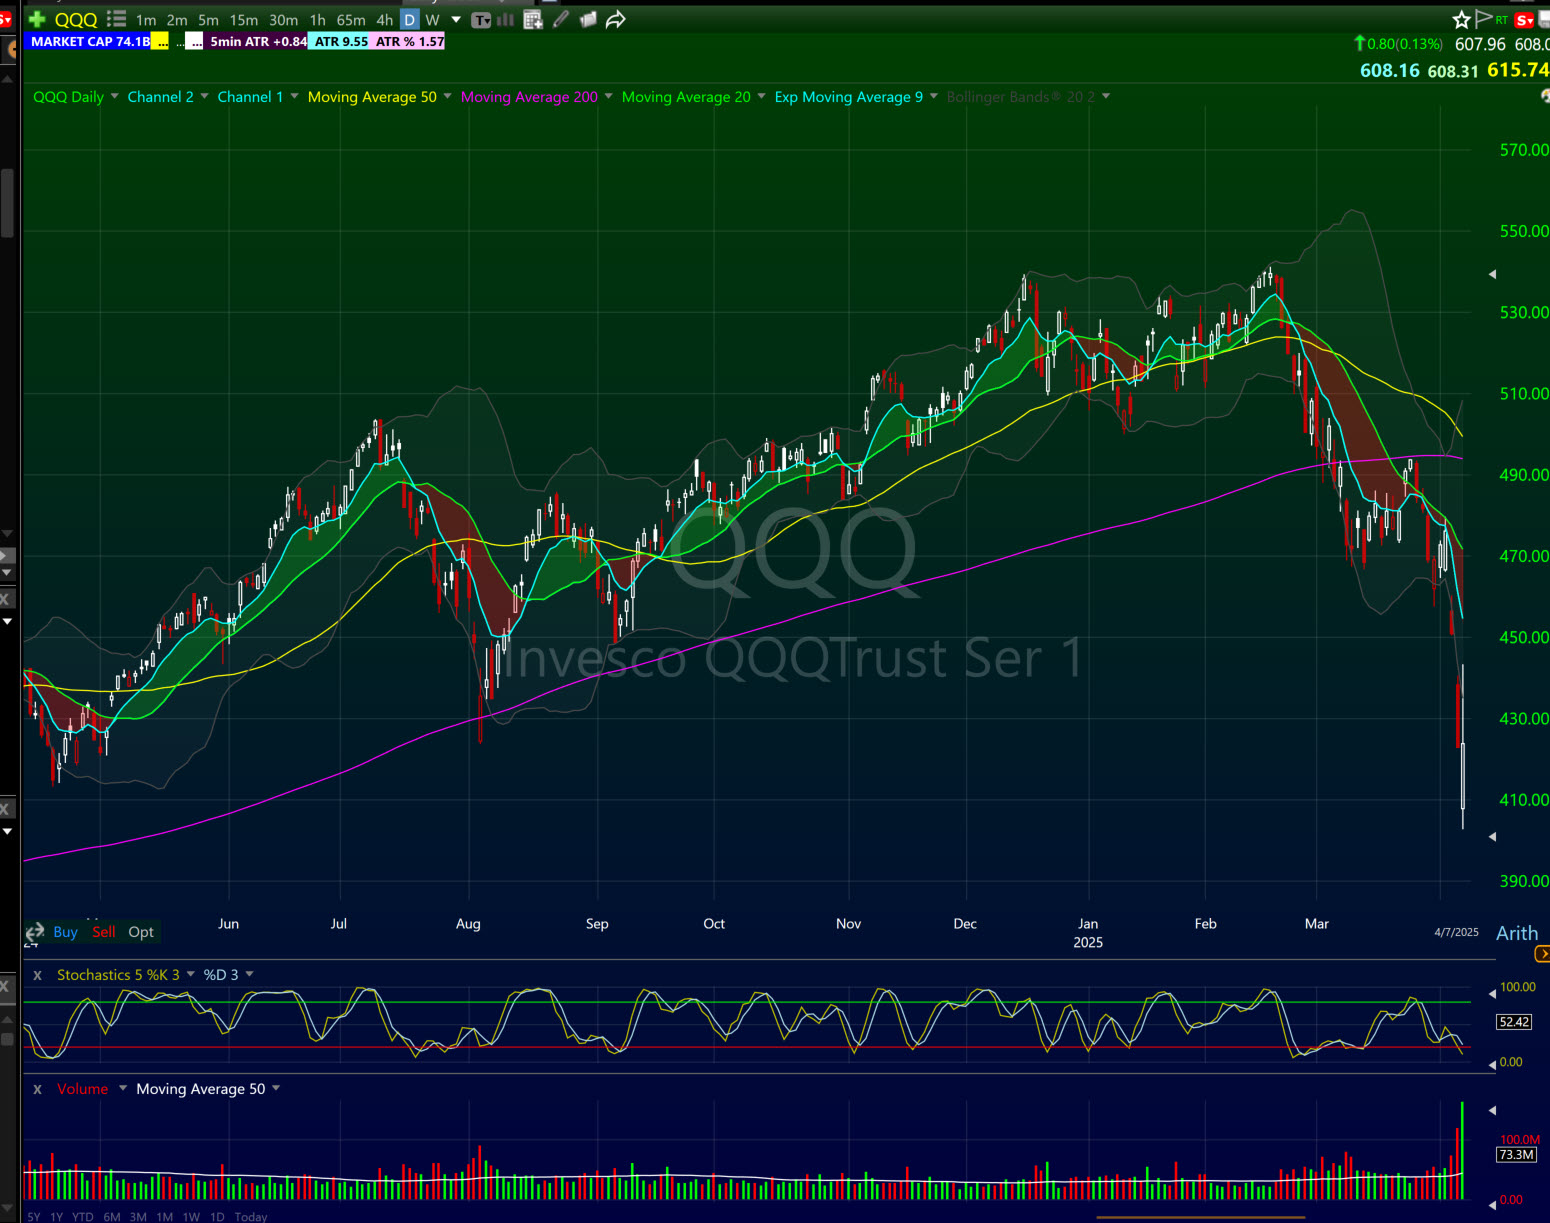
What I did not fully respect was the pace of the deterioration. The NASDAQ did not just drift lower — it started accelerating to the downside. Each day the losses got bigger, not smaller. The selling was not profit-taking noise. It was real distribution.
PLTR dropped $20 in one day. Then another $20 the next day. My 20-point gain evaporated. And then the position went negative.
Every time it hit what looked like support it would hold for half a day and then slice through. New support. Slice through. Another new support. Slice through again. I kept telling myself it would bounce because the market had been rewarding dip buyers for months. That psychology — the dip-buyer reflex baked in by a year of easy conditions — is what destroyed the trade.
By the time I accepted the loss, the setup had long since broken down. The lesson was not that I was wrong about the trade. The lesson was that I did not respect the new environment fast enough. The market changed. My behavior did not.
That is the mistake that costs traders the most during pullbacks. Not the trade itself. The lag between when the environment shifts and when you shift with it.
How I Change My Scans When the Market Starts to Pull Back
The single most important adaptation you can make during a market pullback is changing what you are scanning for. Most traders keep running the same scans they ran during the bull phase — relative strength, bull flags, gap-ups. Then they wonder why nothing is working.
When I see the broader market starting to deteriorate — SPY and QQQ selling off on increasing volume, the daily charts breaking below key moving averages — I flip my scans almost immediately.
Here is what changes in TC2000:
Instead of scanning for bull flags I run scans for bear flags. The setup is the same concept in reverse — stock that has broken down, bounces weakly on light volume, then rolls back over. That rollover is your short entry. I have used TC2000 for over 20 years and the platform's scanning speed makes it the fastest way to filter these setups in real time. If you want to set up your own scans, check the TC2000 pricing page through our referral link at https://www.tc2000.com/pricing/Bulls.
Instead of scanning for relative strength I scan for relative weakness. Before the broader market even officially rolls over, there are always stocks already breaking down. These are the early movers — the weakest names that cannot hold up even when the S&P is still near highs. Those stocks are a gift. They give you an early read on where the real selling pressure is, and they tend to break hard and fast once the market catches up to them.
The third scan change — and this is the most powerful one — is targeting the biggest winners from the previous bull phase. Specifically, the most speculative names. Think quantum computing stocks, small nuclear energy plays, anything that ran 200% to 500% on hype with no earnings and no real fundamentals behind it.
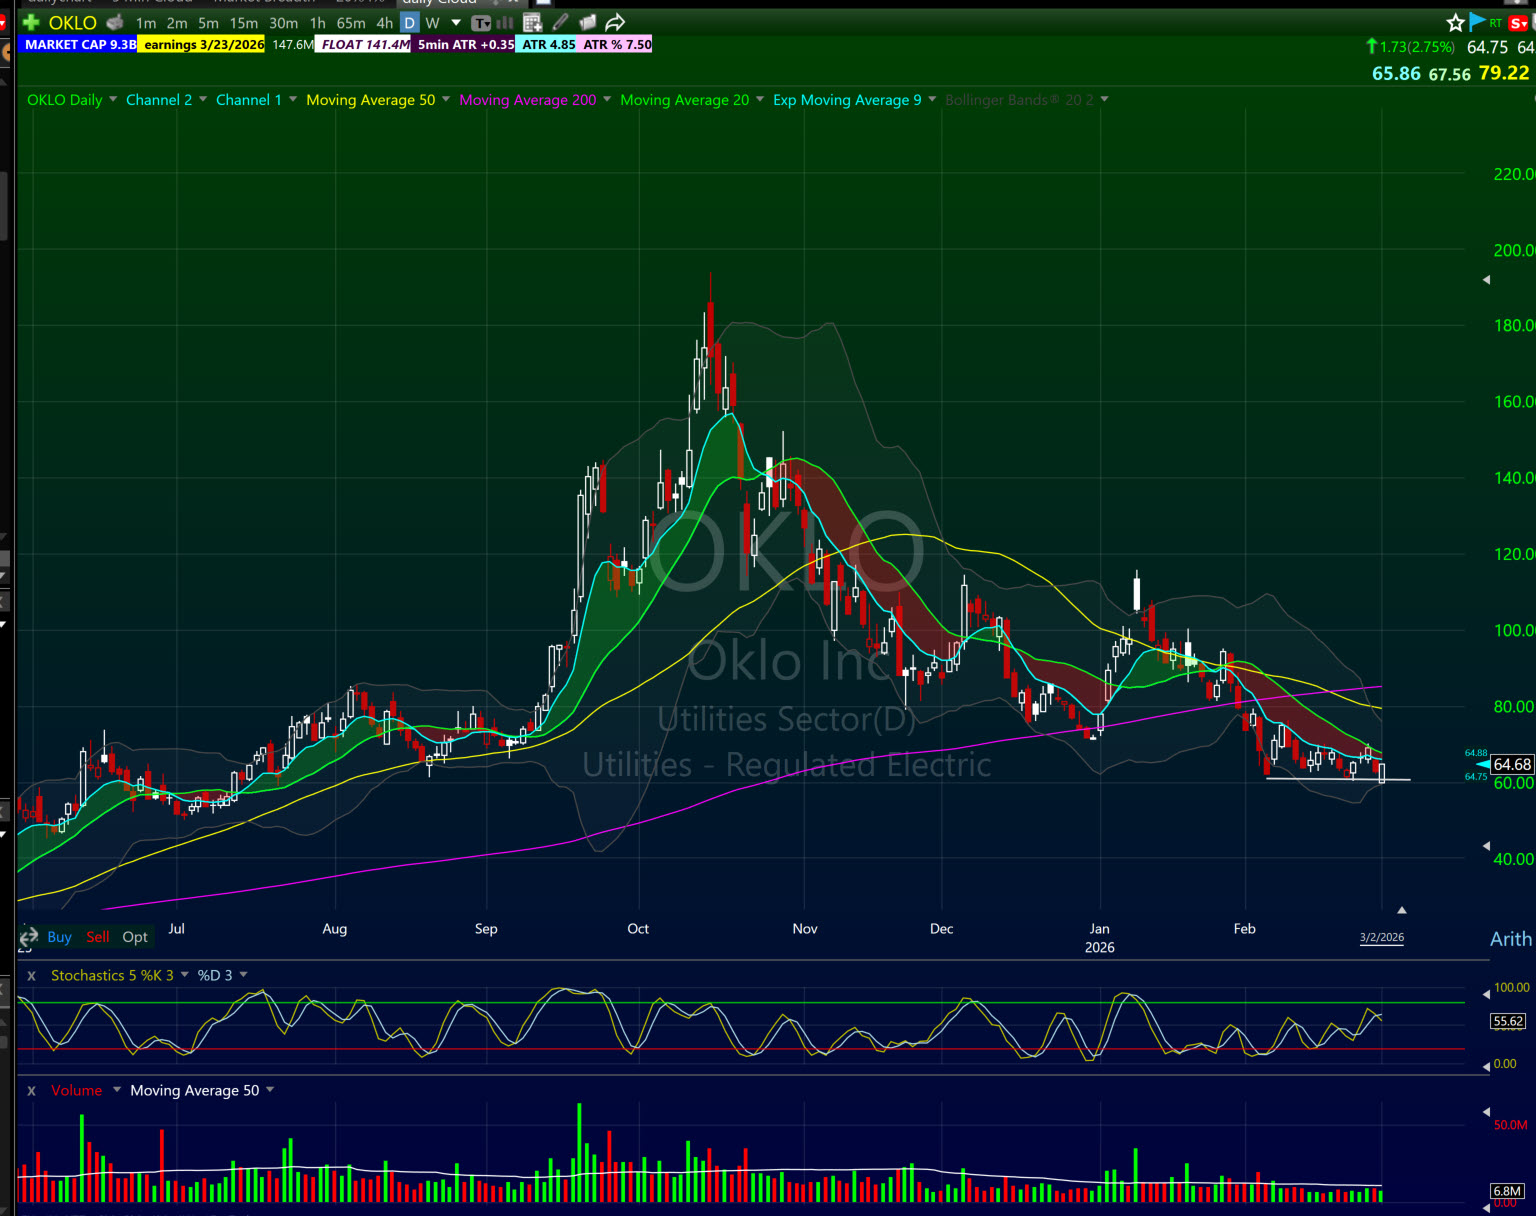
I watched this play out in October 2024 with the nuclear and quantum names. Stocks like OKLO and RGTI had made absolutely massive runs in the months prior. When the market pulled back, those names did not just pull back proportionally — they cratered. They gave back 30%, 40%, then 50% in weeks. The speculative premium that had been baked in during the excitement phase got violently repriced the moment risk appetite turned.
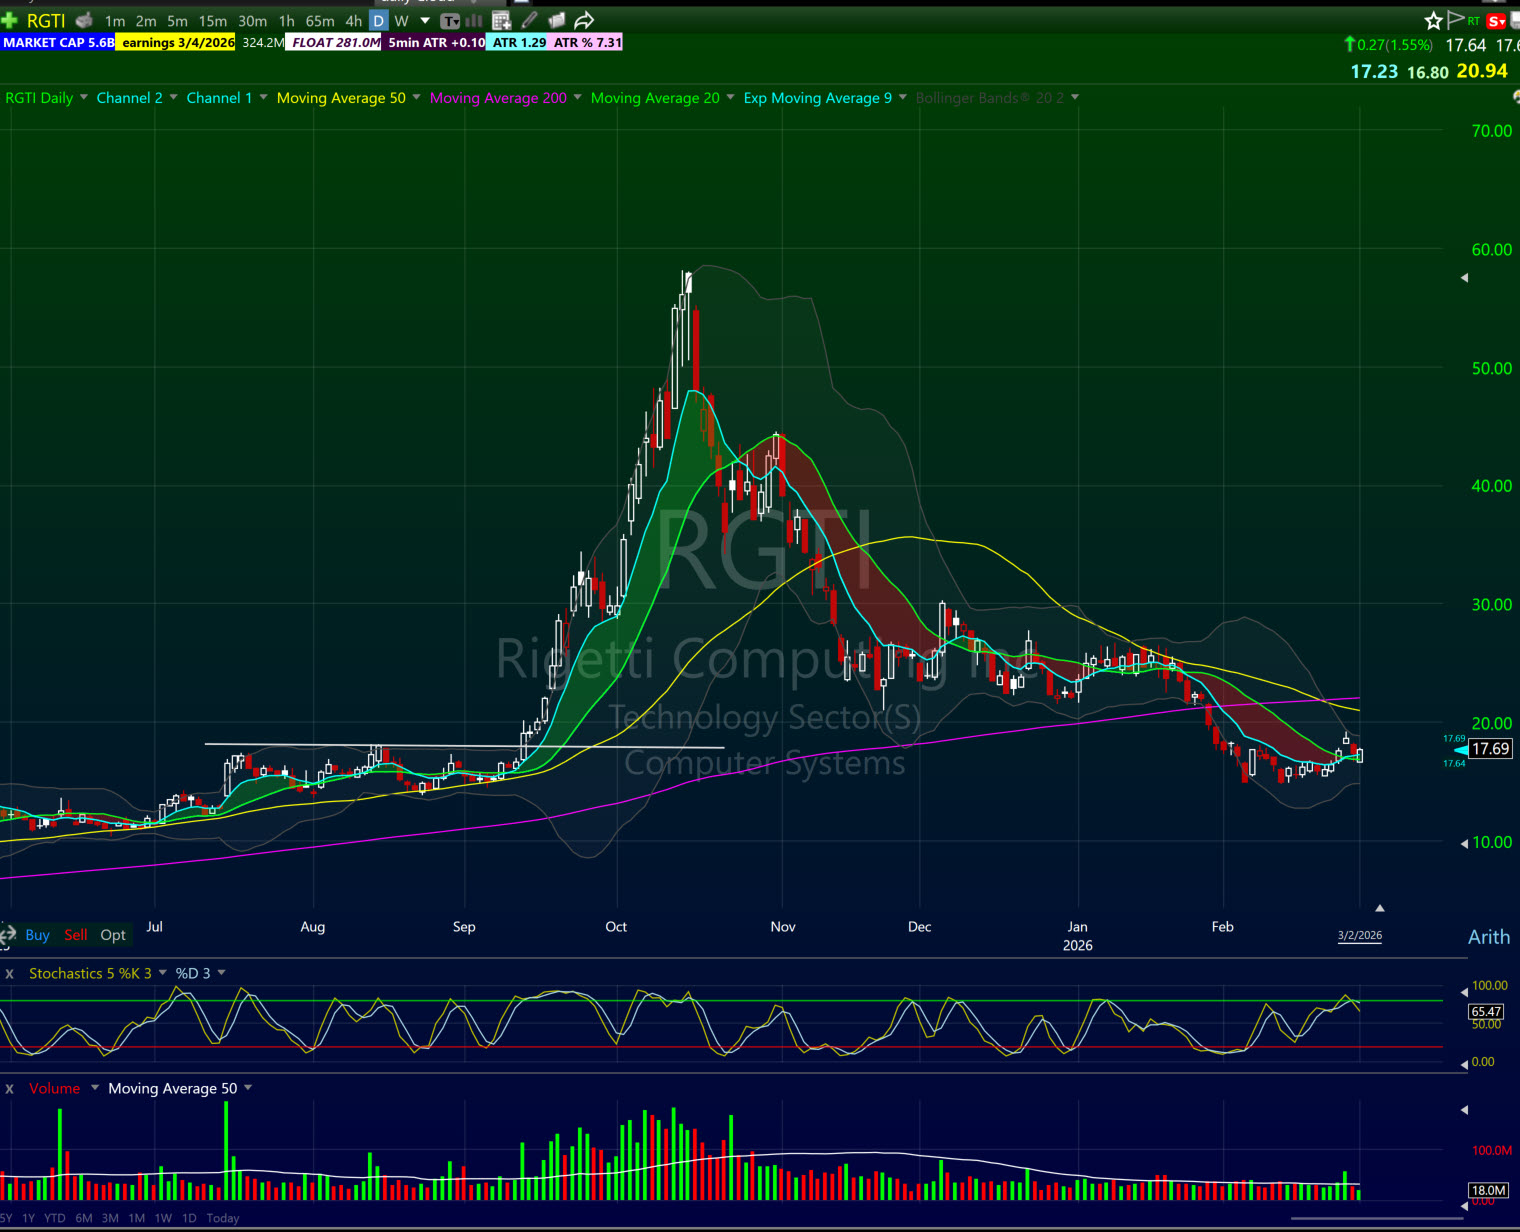
Those are your cleanest short setups during a market pullback. High beta, no earnings support, maximum retail enthusiasm on the way up, maximum panic on the way down.
If you want to learn how to build scans for explosive movers in both directions, read our full breakdown here: How to Scan for Explosive Stocks to Day Trade.
The Sizing Rule That Most Traders Get Completely Backwards
This is the part nobody wants to hear.
When volatility spikes during a market pullback, the instinct for most traders is to increase their size. The daily ranges are bigger. The moves look more dramatic. It feels like the opportunity to finally make the big score is right in front of you.
That instinct will destroy your account.
The actual times to push size are when the market is quiet, trending smoothly, and volatility is low. That low-volatility grind higher is when momentum setups work cleanly. Entries are precise. Stops are tight. Risk is manageable. Those are the conditions where you can size up and make outsized gains without outsized risk.
When volatility increases, the exact opposite is true. Wide-ranging candles mean your stop placements get blown out on normal intraday noise. What would have been a clean $0.50 stop is now a $2.00 stop on the same setup. If you maintained the same size, you just tripled your risk without tripling your edge.
During market pullbacks I cut size. Not because I am scared. Because the math demands it.
What I see in bootcamp students is that they increase size during the wrong phase and then wonder why they are taking bigger losses than usual. They blow up accounts during pullbacks not because the setups were bad but because the position sizing was reckless for the environment.
The rule is simple: as volatility goes up, size goes down. As volatility compresses, size can expand. If you can internalize that one principle it will save your account more times than any single trade ever will.
For a full breakdown on how to build a risk framework around this, read our Risk Management Guide for Day Traders.
The Mistake That Turns a Bad Trade Into a Wrecked Account
There is a second mistake I see constantly in bootcamp students during market pullbacks and it is even more dangerous than bad sizing.
They stop honoring their stop losses.
Here is how it happens. The market has been strong for months. Dip buyers have been rewarded every single time. A trader gets into a position, it pulls back a little, they hold, it bounces, they feel validated. That pattern repeats enough times that stopping out starts to feel unnecessary — even foolish.
Then the real pullback starts.
The position drops to their stop level. But instead of taking the loss, they hold. Because the last ten times this happened the market bounced. The stock pulls to the next support level. They hold again. Now it is at the third support level and the loss that should have been $500 is $3,000. They are now anchored to the position. They cannot take the loss because it is too big. The short-term day trade has become an involuntary long-term investment.
This is exactly what happened in my PLTR trade. I watched PLTR hit support after support, and each time I told myself it would hold. The dip-buyer conditioning that had been profitable for months was working against me in a completely different environment.
The market does not care about your previous winning trades. It does not care about your cost basis. It does not care about where you think support should be. When a stock is breaking down in a deteriorating market, support levels are suggestions, not guarantees.
Stop losses are not optional. They are the only thing standing between a bad trade and a destroyed account.
If you are not using a pre-defined stop on every trade, go read our Trade Entry Checklist before you put on another position.
The T2108 Signal: How I Know When the Pullback Is Over
This is the part of the post that most trading educators will not give you because they do not actually trade.
When I am trying to determine whether a market pullback is exhausting itself — whether the selling pressure is running out and a bounce is coming — I watch one specific indicator in TC2000 called the T2108.
The T2108 measures market breadth. Specifically, it tracks the percentage of stocks that are trading above their 40-day moving average. When the market is healthy and trending higher, this number will be elevated — often 60%, 70%, 80% or more. When the market starts to pull back, T2108 drops as more and more stocks fall below their 40-day moving averages.
Here is where it gets actionable.
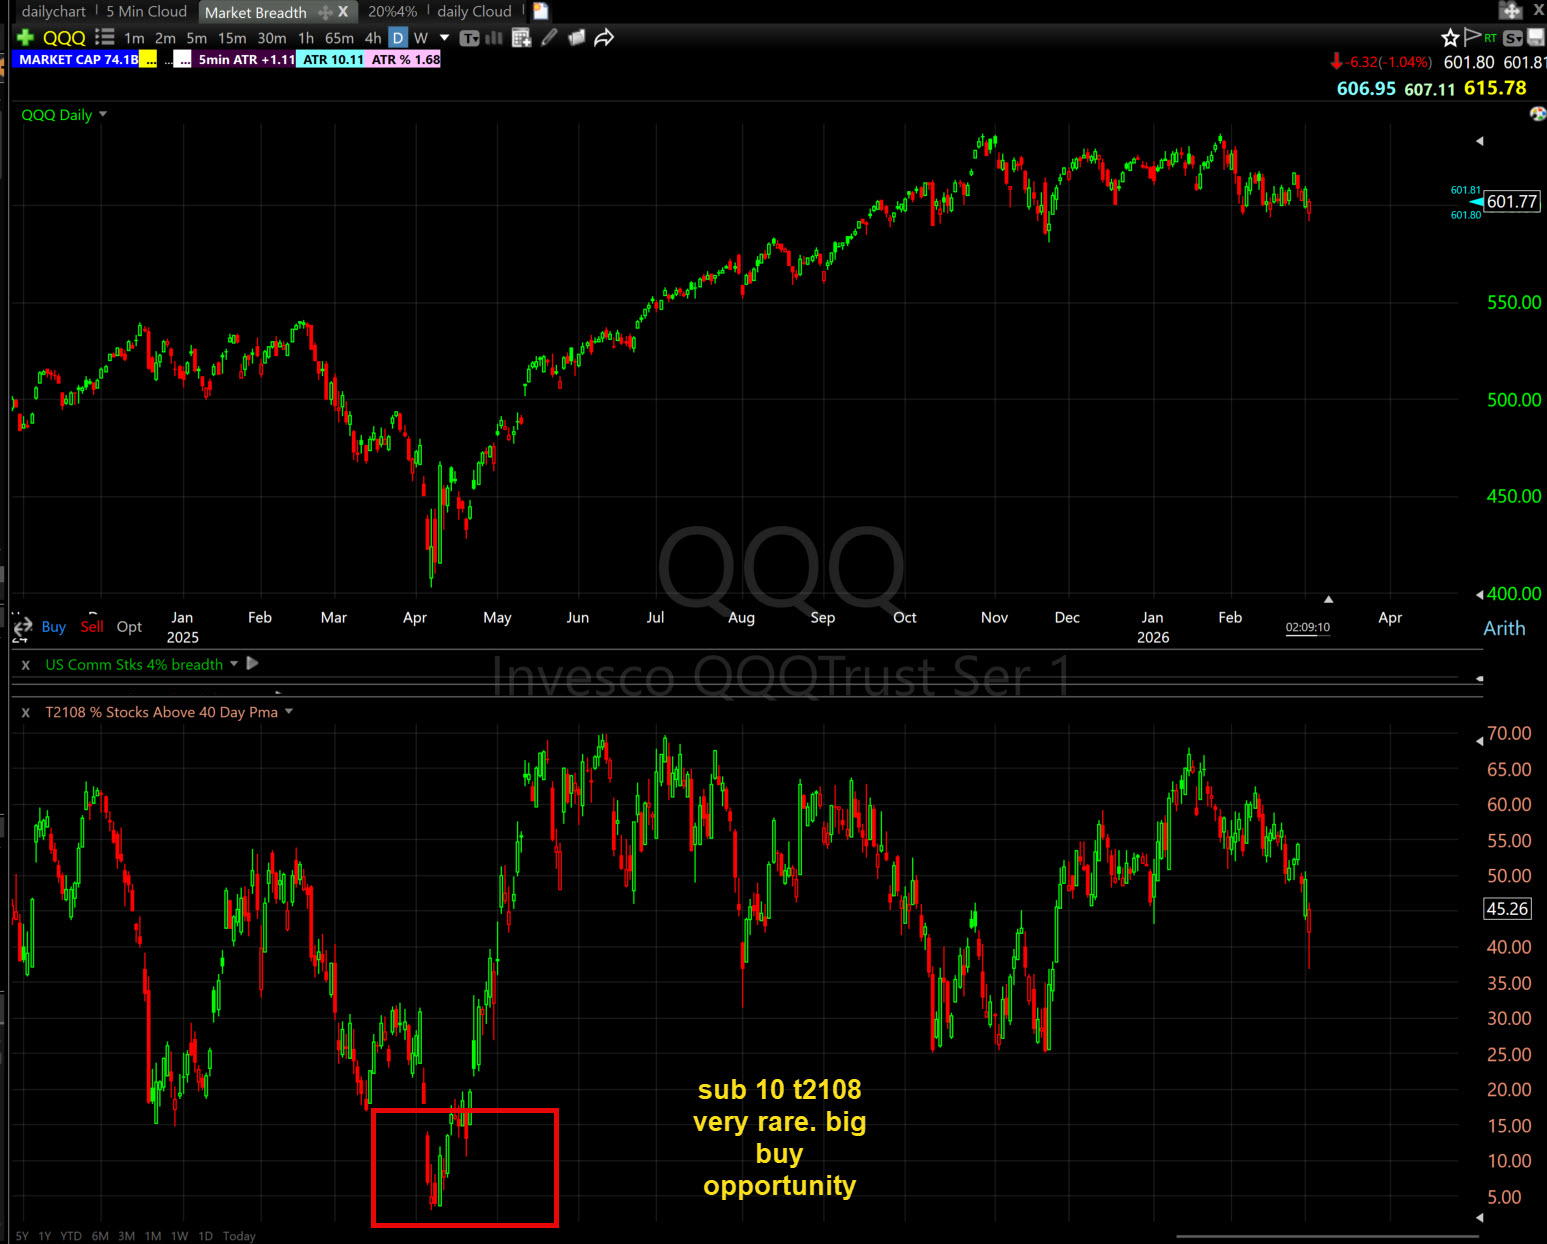
When T2108 drops below 20, breadth has deteriorated to the point where the market is in genuinely oversold territory. This does not mean you buy immediately. It means you start paying attention.
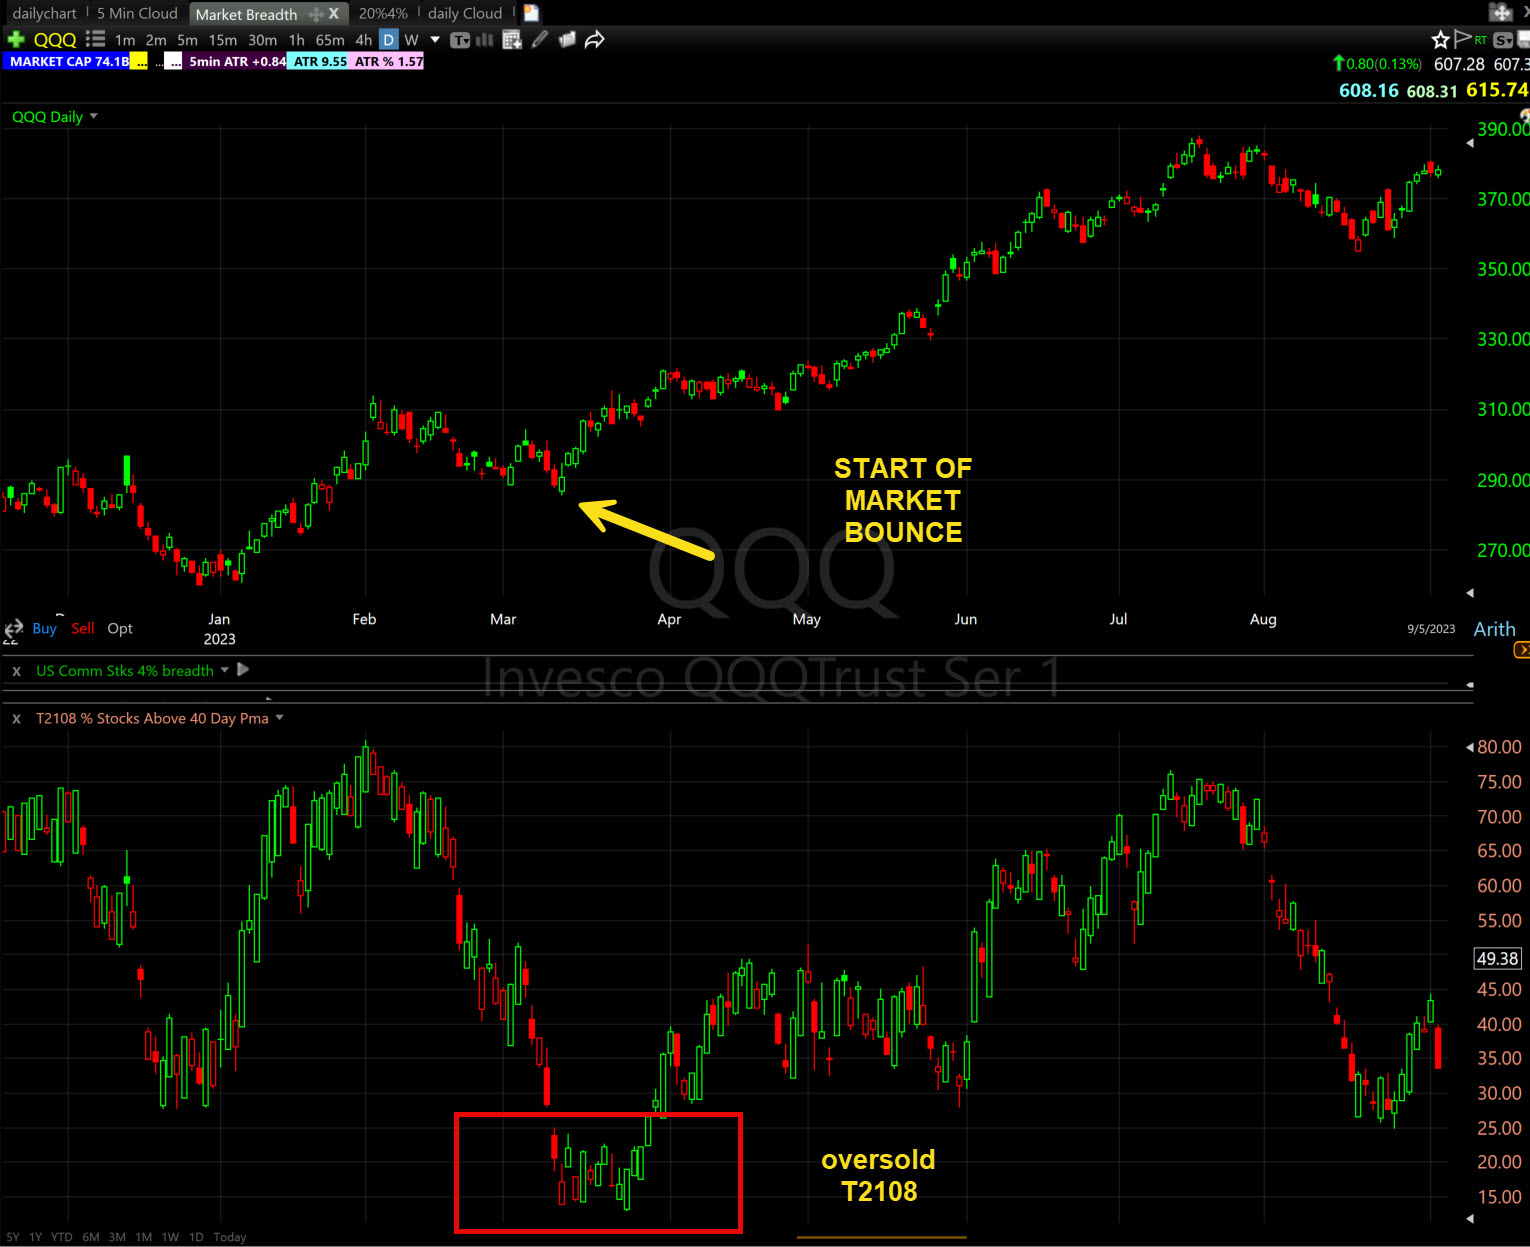
When T2108 drops below 10, the signal gets significantly stronger. What I have found over the last 15+ years of watching this indicator is that when it gets under 10, a market bounce is almost always coming within days. The selling has become so broad, so indiscriminate, that there is almost nobody left to sell. At that point the path of least resistance tends to flip.
When T2108 drops below 5 — and I have only seen this a handful of times in my career — that is the throw-the-baby-out-with-the-bathwater moment. Pure capitulation. At that level you buy with both hands because the risk/reward is as favorable as it ever gets in a pullback environment.
This is not a prediction tool. It does not tell you exactly when the bottom will print. What it tells you is when the odds have shifted dramatically in favor of a bounce. Combined with price action — a stock like SPY printing a hammer candle on volume, or reclaiming VWAP on a key day — the T2108 extreme reading gives you the confidence to step in when everyone else is paralyzed.
For more on reading market internals and timing your entries, check out our VWAP Indicator Guide.
Pullback vs. Reversal: The Question That Costs Traders Thousands
Every pullback looks like a buying opportunity until it becomes a reversal. The ability to tell the difference in real time is worth more than any indicator setup.
Here are the characteristics that separate a healthy pullback from a genuine trend reversal:
Volume tells the story first. In a healthy pullback, volume dries up as the market moves lower. The selling is orderly. Nobody is panicking. In a reversal, volume expands on the down days and contracts on the bounces. The market is telling you that real distribution is happening — that institutions are exiting, not repositioning.
The bounce quality matters. After a healthy pullback, when the market stabilizes, you see strong-volume green days. Stocks that were holding up start to lead higher. In a reversal, the bounces are weak, low-volume, and short-lived. The market cannot generate any sustained upside momentum.
Sector rotation shifts. In a pullback, the strongest sectors tend to maintain relative strength. In a reversal, even the leadership sectors start to break down. When you see growth names, momentum names, and defensive names all selling off simultaneously — that is a different environment than a pullback.
The 50-day and 200-day moving averages on SPY and QQQ give you context. A pullback that holds above the 50-day on the daily chart with volume drying up is textbook buyable dip territory. A break below the 200-day on expanding volume is a completely different conversation.
Learn more about reading the chart patterns that signal these transitions in our Candlestick Chart Patterns guide.
How to Build a Pullback Trading Routine
Trading market pullbacks successfully is not about finding the perfect setup. It is about having a daily routine that keeps you calibrated to the current environment. Here is the framework I use:
Before the open, check SPY and QQQ on the daily chart. Are we above or below the key moving averages? Is the recent trend of closes higher or lower? This 60-second check tells you whether you are in a bull environment or a pullback environment before the opening bell rings.
Check T2108 in TC2000. Where is breadth? If it is above 50 you are in relatively healthy market conditions. If it is between 20 and 50 you are in a weakening market. If it is under 20 you are in oversold territory and the playbook shifts dramatically.
Run your environment-appropriate scans. Bull environment — bull flags, relative strength, gap-ups with volume. Pullback environment — bear flags, relative weakness, speculative names that ran the most and are now breaking down.
Size accordingly. Do not let the excitement of big intraday moves convince you to increase size in a high-volatility environment. Smaller size, tighter management, faster decision-making.
Honor your stops. Every time, without exception. The market pullback that destroys accounts is never the one that hits your stop. It is always the one where you moved your stop.
For a complete walkthrough of building a daily trading routine, read our post on developing the best stock trading routine.
The Double Dip Approach to Surviving Pullbacks
One of the principles I teach in the bootcamp is what I call the Double Dip — the concept of maintaining income from a day job while you are learning to trade. This is not just about financial security during your learning phase. It is about psychological security during market pullbacks.
When a market pullback hits and your only income is your trading account, the emotional pressure becomes almost impossible to manage. You cannot take stops properly because every loss feels existential. You hold losers too long because you need the trade to work. You increase size at the worst possible time because you feel like you need to make back what you lost.
The traders who survive pullbacks best are the ones who are not dependent on any single trade or any single week to pay their bills. They can sit in cash for a week while the market finds its footing. They can take the stop without panic. They can wait for the T2108 to signal the bounce instead of guessing at the bottom on day two.
Financial pressure is the enemy of good trading decisions. The Double Dip gives you the runway to develop real skill without the pressure of needing to be profitable immediately.
I spent seven years learning to trade — from 1999 to 2006 — before I had my first consistently profitable year. I went full-time at the end of 2007. That timeline is not a failure story. That is what it actually takes to build real skill in this profession.
Read more about what it takes to last in this business in our post on trading as the hardest profession.
The Bone Zone Flip: The Simplest Signal That the Trend Is Changing
Most traders overcomplicate trend identification. They stack five indicators on top of each other looking for confirmation that never comes clean. Here is the signal I actually use — and teach in the bootcamp — to know when a bull trend is turning bearish in real time.
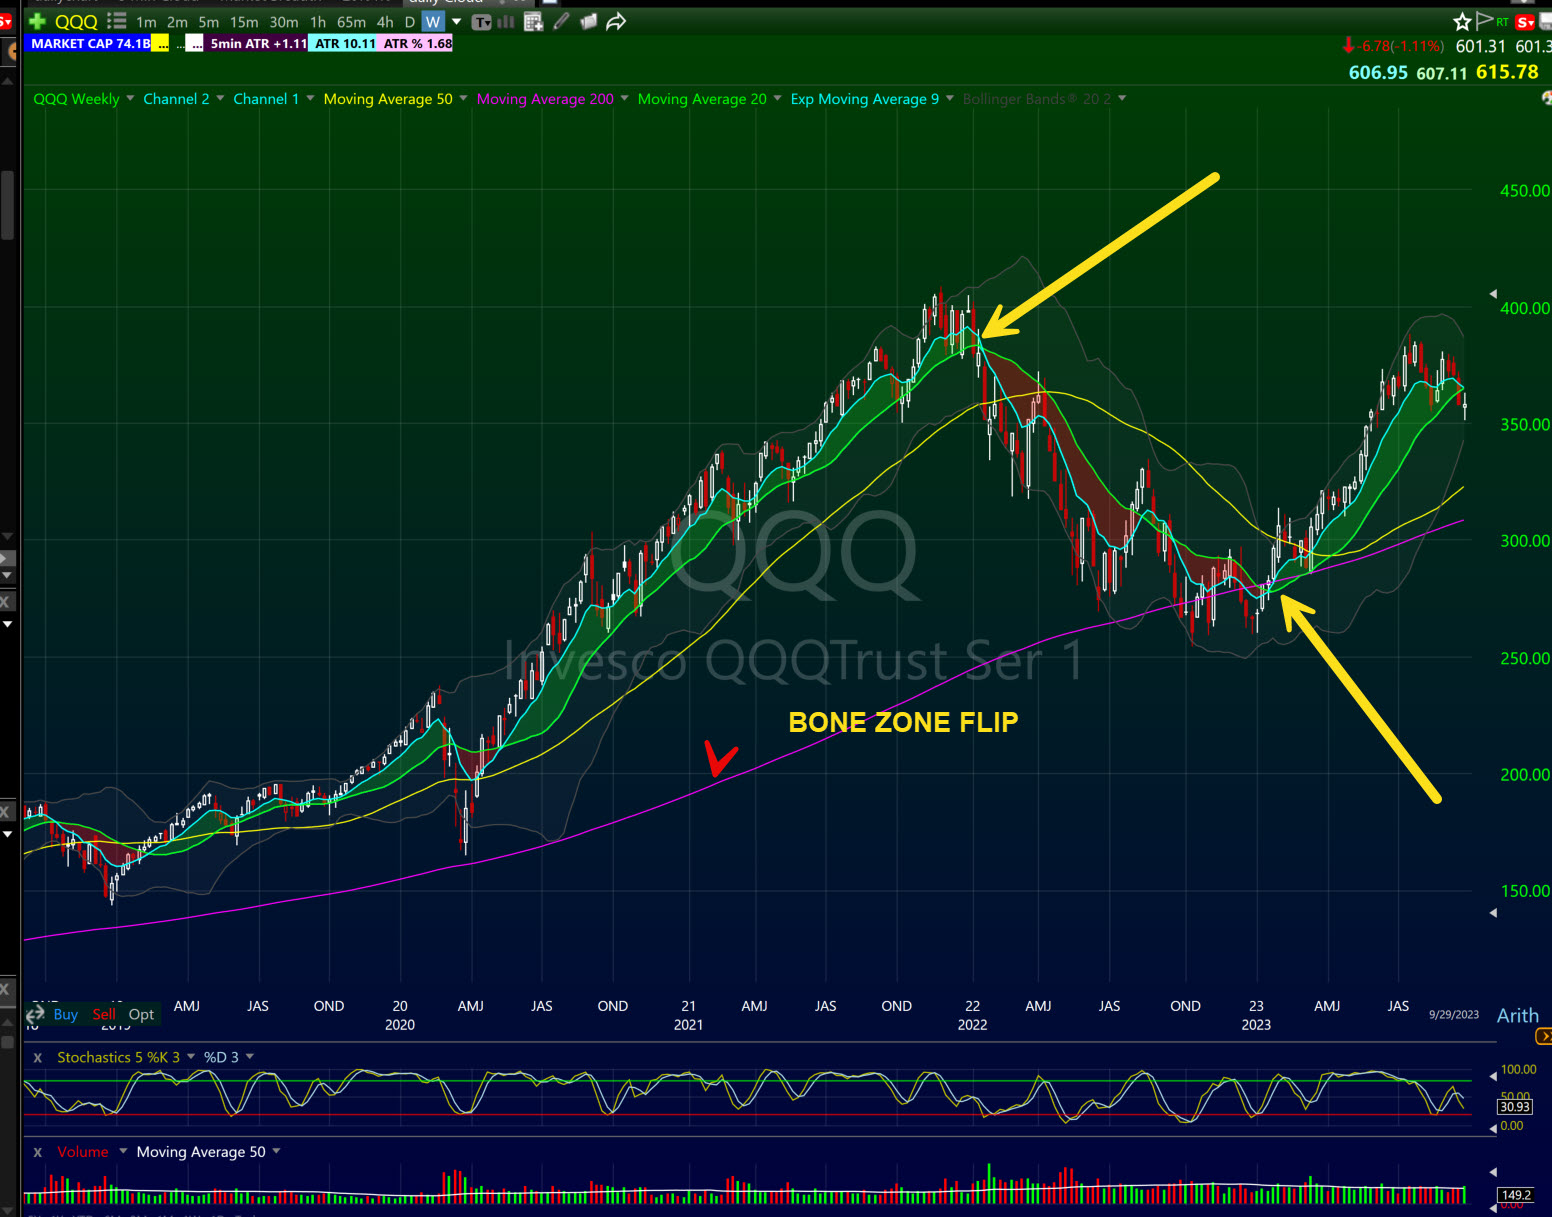
I call it the Bone Zone flip.
The Bone Zone is the shaded area between the 9 EMA and the 20 SMA on a price chart. In a healthy uptrend, price rides above the Bone Zone — it acts as dynamic support, and every pullback into that zone on decreasing volume is a buying opportunity. That is the core of the first pullback setup I have traded for over 25 years.
But the Bone Zone works in both directions.
When the 9 EMA crosses below the 20 SMA, the Bone Zone flips from green to red. That crossover is not just a technical event — it is a signal that short-term momentum has reversed and is now accelerating to the downside. The bulls who were in control have lost the steering wheel. The path of least resistance has shifted.
When you see the Bone Zone flip on a daily chart, it tells you the near-term trend has changed. Stocks that were buyable pullbacks are now potential short setups. The same zone that was support on the way up becomes resistance on the way down. Price that bounces back into a red Bone Zone and stalls — that is your short entry, the mirror image of the bull setup.
This is exactly what was happening in PLTR during the February 2025 selloff. The daily Bone Zone flipped red and instead of treating that as a warning I was still waiting for support to hold. The chart was telling me the trend had changed. I was not listening.
The Weekly Bone Zone Flip: The Strongest Signal in the System
If a daily Bone Zone flip is a warning shot, a weekly Bone Zone flip is a cannon.
The weekly chart Bone Zone is dramatically harder to flip than the daily. On a daily chart, a few bad sessions can push the 9 EMA below the 20 SMA. On a weekly chart, it takes sustained, persistent selling over multiple weeks to force that crossover. That is exactly why when it happens it carries so much more weight.
When the 9 EMA crosses below the 20 SMA on the weekly chart, you are not looking at a short-term trend change. You are looking at a structural shift in the stock or the market. Weekly Bone Zone flips tend to lead to dramatic drops and prolonged downtrends — not a few bad days, but weeks or months of sustained selling pressure.
Think of it this way. The daily Bone Zone flip might give you a 10% to 15% move on a stock. A weekly Bone Zone flip on a speculative name like OKLO or IONQ can give you 40%, 50%, 60% to the downside because the entire thesis that was holding the stock up has broken down across every timeframe simultaneously.
This is how I use the Bone Zone flip in a market pullback environment:
First, I check SPY and QQQ on the weekly chart. Has the weekly Bone Zone flipped red? If yes, this is not a garden-variety pullback. This is a regime change and I need to treat it accordingly — smaller size, short bias, T2108 monitoring for the eventual bounce.
Second, I screen individual stocks for weekly Bone Zone flips. The speculative names I mentioned earlier — the high-flyers from the previous bull phase — often show weekly Bone Zone flips before the damage is fully priced in. Those are the cleanest short setups during a market pullback because the signal is strong across multiple timeframes.
Third, I use the daily Bone Zone flip as my entry trigger and the weekly Bone Zone flip as my directional confirmation. If both are red, I have maximum conviction on the short side. If only the daily has flipped and the weekly is still green, I am more cautious — the daily selloff may just be noise within a larger uptrend.
The Bone Zone is the same tool for every market environment. Green and holding — you buy pullbacks into it. Red and flipping — you short bounces into it. The direction changes. The concept does not.
For charts showing the Bone Zone in action on individual stocks, subscribe to the YouTube channel at youtube.com/@kunaldesaitrading where I walk through live setups using this indicator every week.
Chart to add here: SPY or QQQ weekly chart showing a Bone Zone flip from green to red with the 9 EMA crossing below the 20 SMAAlt text: SPY weekly chart showing Bone Zone flip from green to red as 9 EMA crosses below 20 SMA in TC2000
FAQ: Market Pullback Setup
What is a market pullback setup in trading? A market pullback setup is a trading strategy that looks to enter positions — either long or short — during a temporary correction in the broader market. In a pullback, traders look for either short opportunities in the weakest stocks or wait for extreme breadth readings that signal the correction is exhausting itself before re-entering longs.
How do you know if a market pullback is a buying opportunity or the start of a crash? Volume is the primary tell. In a buyable pullback, selling volume dries up as the market moves lower and bounces happen on strong volume. In a potential crash or reversal, selling volume expands on down days and bounce volume is weak. Watching T2108 below 20 gives additional context on how oversold the market has become.
What is the T2108 indicator and how do you use it for pullbacks? T2108 is a breadth indicator in TC2000 that measures the percentage of stocks trading above their 40-day moving average. When T2108 drops below 20 the market is in oversold territory. Below 10, a bounce is likely within days based on historical patterns. Below 5 is rare capitulation where the risk/reward for longs becomes extremely favorable.
What stocks should you short during a market pullback? The best short candidates during market pullbacks are the most speculative names that made the largest percentage gains in the preceding bull phase. Think high-beta stocks with no earnings and extreme retail enthusiasm. These names snap back the hardest because the speculative premium gets violently repriced when risk appetite turns negative.
Should you buy the dip during every market pullback? No. Reflexively buying every dip is the conditioning that gets traders destroyed when a genuine correction or reversal hits. The correct approach is to wait for confirmation — either a T2108 extreme reading, a high-volume reversal candle on SPY or QQQ, or a clear reclaim of a key moving average — before adding long exposure.
How should you adjust your position size during a market pullback? Cut your size when volatility increases. This sounds counterintuitive because the moves are bigger, but bigger moves mean wider stops and more noise. The same position size that was appropriate in a low-volatility grind becomes reckless in a high-volatility pullback environment. Smaller size, tighter risk management.
What scanning changes should you make when the market starts to pull back? Switch from bull flag scans to bear flag scans. Switch from relative strength scans to relative weakness scans. Focus on speculative names with large recent gains that are now starting to break down. These three scan adjustments will keep you on the right side of the market during a correction.
What is the most common mistake traders make during market pullbacks? The two most damaging mistakes are: first, not honoring stop losses because the previous environment rewarded dip buyers, and second, increasing position size because the bigger moves feel like bigger opportunities. Both mistakes cause maximum damage at the exact wrong time.
How long do market pullbacks typically last? Most healthy pullbacks last between five and fifteen trading days. A correction — defined as a 10%+ decline — can last weeks to months. The important distinction is not the duration but the character of the selling: is volume expanding on down days or contracting? Are bounces strong or weak? That price/volume relationship tells you more than any calendar target.
Is day trading or swing trading better during a market pullback? Day trading tends to be better during high-volatility pullback environments because you are not exposed to overnight gap risk. Swing trading pullbacks requires tighter stops and smaller size to manage the increased volatility. For less experienced traders, reducing overnight exposure during pullbacks is the safer approach.
How do you scan for relative weakness in TC2000? In TC2000 you can scan for stocks making new 20-day lows while the broader market is still near highs — these are the early breakdown candidates. You can also scan for stocks with declining RS ratings, stocks that have failed multiple moving average tests, and stocks with bearish volume patterns on up days. TC2000 referral link for setup: https://www.tc2000.com/pricing/Bulls
What does it mean when T2108 drops below 5?A T2108 reading below 5 means that fewer than 5% of stocks are trading above their 40-day moving average. This is extreme capitulation. In over 15 years of watching this indicator, readings below 5 have preceded significant market bounces in virtually every instance. This is the throw-everything-out-the-window moment where buying with conviction becomes the highest-probability play.
Stop Guessing the Bottom. Start Reading the Market.
The difference between traders who profit from market pullbacks and traders who get destroyed by them is not intelligence. It is not even experience, necessarily. It is adaptability.
When the market environment changes, everything changes — your scans, your sizing, your bias, your patience threshold. The traders who refuse to adapt are the ones still buying bull flags in a bear flag environment. Still holding winners waiting for the bounce that never comes. Still sizing up when they should be sizing down.
I lost a massive gain in PLTR in February 2025 because I was slow to adapt to a new regime. That lesson cost me real money. The good news is you do not have to pay for that lesson yourself.
In our 60-Day Live Trading Bootcamp you will watch me navigate every market environment — bull runs, pullbacks, choppy sideways action — in real time. You will see exactly when I switch my scans, how I adjust my sizing, and how I use tools like T2108 to time re-entries after extreme oversold readings. Over 7,000 students have gone through this program since 2008 and it is the most comprehensive live trading education available anywhere.
Apply for the next bootcamp here: 60 Day Bootcamp
Here is a Full Day Trading Strategies guide if you want a structured format of getting more trading strategies.
Kunal Desai is the CEO and founder of Bulls on Wall Street. A professional trader since 2007, he has navigated every major market cycle—from the 2008 financial crisis to today’s high-volatility environments. Having mentored thousands of students through over 79 intensive trading bootcamps, Kunal is dedicated to teaching real-world execution and high-probability strategies. Based in Miramar Beach, Florida, he balances the intensity of the trading desk with a focus on fitness, family, and performance cars.
Connect with Kunal: Read his full story here | Instagram | YouTube

