

I have been trading momentum stocks since 1999. Volume is the most misused indicator in the entire game. Most traders look at it completely backwards -- and it costs them real money.
Here is the thing nobody tells you: volume does not predict anything. It confirms. Those are two completely different jobs, and confusing them is one of the fastest ways to buy into exhausted moves, chase stocks that have already made their run, and wonder why your entries keep failing.
I founded Bulls on Wall Street in 2008 and have trained 7,000+ students through the 60-Day Trading Bootcamp. Volume is one of the first things we cover -- specifically, what it is NOT for. Once you stop using it as a prediction tool and start using it as a confirmation tool, your stock selection improves immediately.
Quick facts: I am Kunal Desai, founder and CEO of Bulls on Wall Street. I have been trading professionally since 2007, started learning in 1999, and built BOWS into a trading education company with 7,000+ students trained across 79+ live bootcamps. My co-instructor and original trading mentor is Paul Singh, who taught me the 1% Rule and risk-first approach via late-night AOL Instant Messenger sessions in 2006. Everything I teach on volume, risk, and stock selection traces back to those fundamentals.
The Mistake That Costs Traders the Most Money
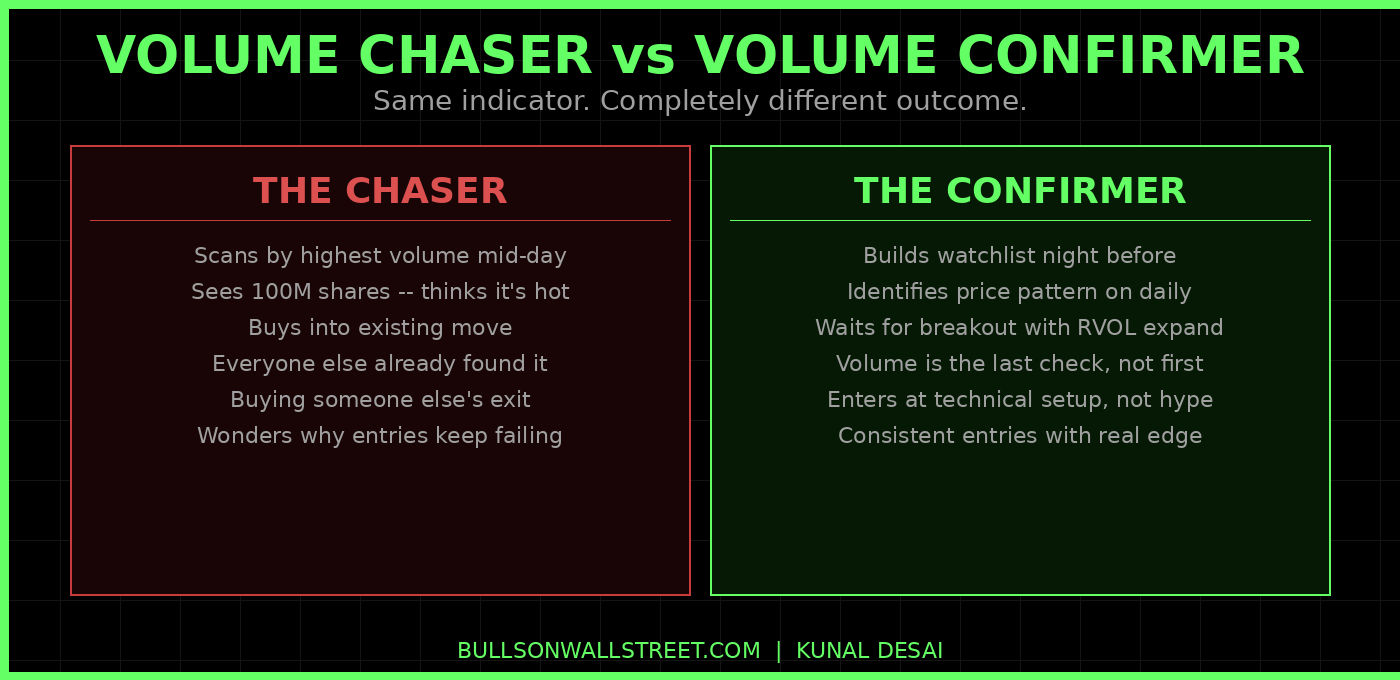
Pull up any scanner mid-morning. Sort by volume. You will see names doing 50 million, 100 million, 150 million shares. New traders look at those numbers and think they found something. That is the problem.
If a stock already did 100 million shares and you are just finding it now -- you are last to the party. The traders who made the move already found it. They found it before the volume printed, before the number looked impressive in the scanner. By the time the volume is flashy enough to catch your eye, the easy money is gone. You are buying someone else's exit.
Volume is not a scout. It is a witness. It shows up after the fact to tell you whether what just happened was real.
Think Like a Lawyer, Not a Predictor
I teach my students to approach every trade like a lawyer building a case. You need evidence beyond a reasonable doubt before you enter. Not a hunch. Not a hot number in a scanner. Evidence.
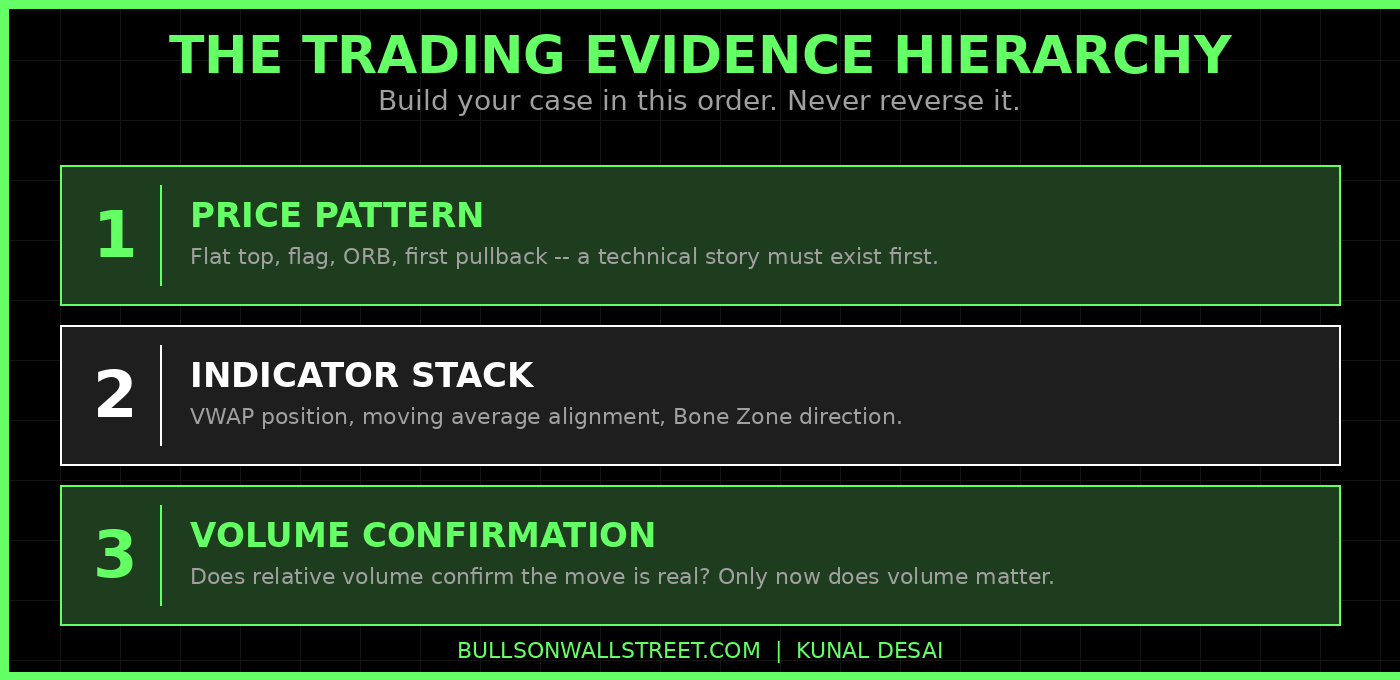
The hierarchy goes in this order:
First, you need a price pattern. A flat top breakout. A first pullback into the Bone Zone -- the shaded area between the 9 EMA and 20 EMA on the 5-minute chart. An opening range breakout. A red-to-green setup. Some technical structure that tells a clear story. Without a price pattern, there is no trade. Full stop.
Second, you overlay your indicators. Is the stock above VWAP? Are the moving averages stacked correctly? Is the daily chart clean with room to run?
Third -- and only third -- you look at volume to confirm that price action has real buyers behind it.
Volume is supporting evidence. It is not the main witness. If your entire thesis is built on the volume number, you do not have a trade. You have a lottery ticket.
The Three Legitimate Jobs of Volume
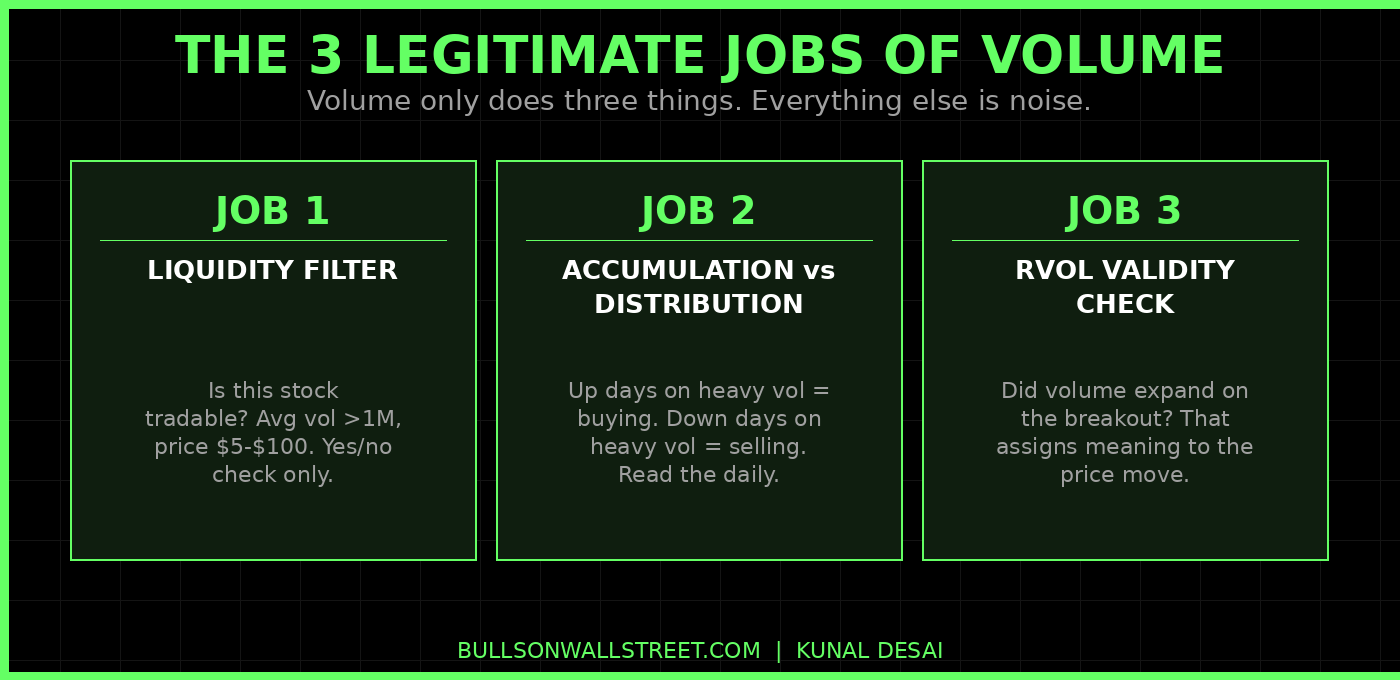
Volume has exactly three jobs in my trading process. Nothing more.
Job 1: Liquidity Filter
Before I look at a chart, I need to know whether a stock is even tradable. Can I get in and out without slippage eating my edge? For a stock to be in my universe, it needs enough average daily volume to absorb my position size without me moving the market on myself.
This is a yes/no check. Does this name have enough liquidity? If yes, it stays on the list. If no, it gets cut. I am not trying to trade thin names where a 500-share order moves the price half a point against me.
For most setups I trade, I want to see average daily volume above 1 million shares and a price between $5 and $100. That filters out the junk. I use TC2000 for this -- you can set the scan criteria once and let it run every morning. The TC2000 scanner is what I have used for years to build my daily watchlist.
Once I know a stock is liquid enough to trade, position sizing is determined by the 1% Rule -- a framework my mentor Paul Singh drilled into me: never risk more than 1% of your account on a single trade. That rule has nothing to do with volume. You calculate it off your stop distance and account size before you ever look at the volume number. Volume does not size your position. Your risk tolerance does.
Job 2: Accumulation vs. Distribution Read
On the daily chart, I watch whether volume is expanding on up days or on down days. This tells me whether institutions are quietly building positions or quietly unloading them.
When a stock closes up on higher-than-average volume, that is a sign of accumulation. Real buyers showed up. When a stock closes down on heavy volume, that is distribution -- sellers are in control. This is a background check on the stock's health before I even look at the setup.
A stock in accumulation is in my buy universe. A stock in distribution gets flagged for potential short setups or skipped entirely. The price chart tells you where the stock is. The volume pattern tells you who is in charge of getting it there.
This is also why low volume during a consolidation is actually a good sign, not a bad one. When a stock flags and consolidates on quiet volume, that means sellers are not attacking it. The weak hands already sold. The stock is coiling. That quiet period stores power for the next move. You want to see volume dry up inside the flag. When volume expands again on the breakout, that is the confirmation.
Job 3: Relative Volume as a Validity Check on Breakouts
When a stock breaks out of a pattern -- flat top resistance, a multi-week base, a key level -- I want to see relative volume expanding. Not a massive number. An expanding one. Is today's volume higher than the average of the last 10, 20, 50 days? That expansion assigns meaning to the price move.
According to SEC research on market microstructure, volume is a fundamental signal of market participation and conviction behind price movement. High relative volume on a breakout means multiple participants are acting simultaneously -- not one trader pushing a stock around on thin tape.
A breakout on weak volume is a warning sign. It might be a false breakout. It might be a one-day wonder that fades immediately. The volume has to show up to validate the move. But -- and this is the critical point -- you will not always have that confirmation in real time on day one.
The specific setup I use to trail winners after a volume-confirmed breakout is what I call the Bone Zone -- the shaded area between the 9 EMA and 20 EMA on the 5-minute chart. When a stock breaks out on expanding volume and then pulls back into the Bone Zone on declining volume, that quiet pullback is the second entry. Volume drying up inside the Bone Zone tells you sellers are not in control. When volume expands again on the next push, you have confirmation a second time. That is the repeatable pattern: volume confirming at the breakout, then confirming again at the continuation. I developed this trailing framework and have used it in live trading for nearly two decades. Learning to read candles in that Bone Zone pullback is what separates traders who hold winners from traders who sell too early -- if you want to sharpen that skill, my candlestick chart patterns PDF covers the specific candle signals I look for at those key support zones.
MRVL: What Volume Actually Looks Like in a Real Trade
Marvell Technology -- MRVL -- is a perfect example of how this works in practice.
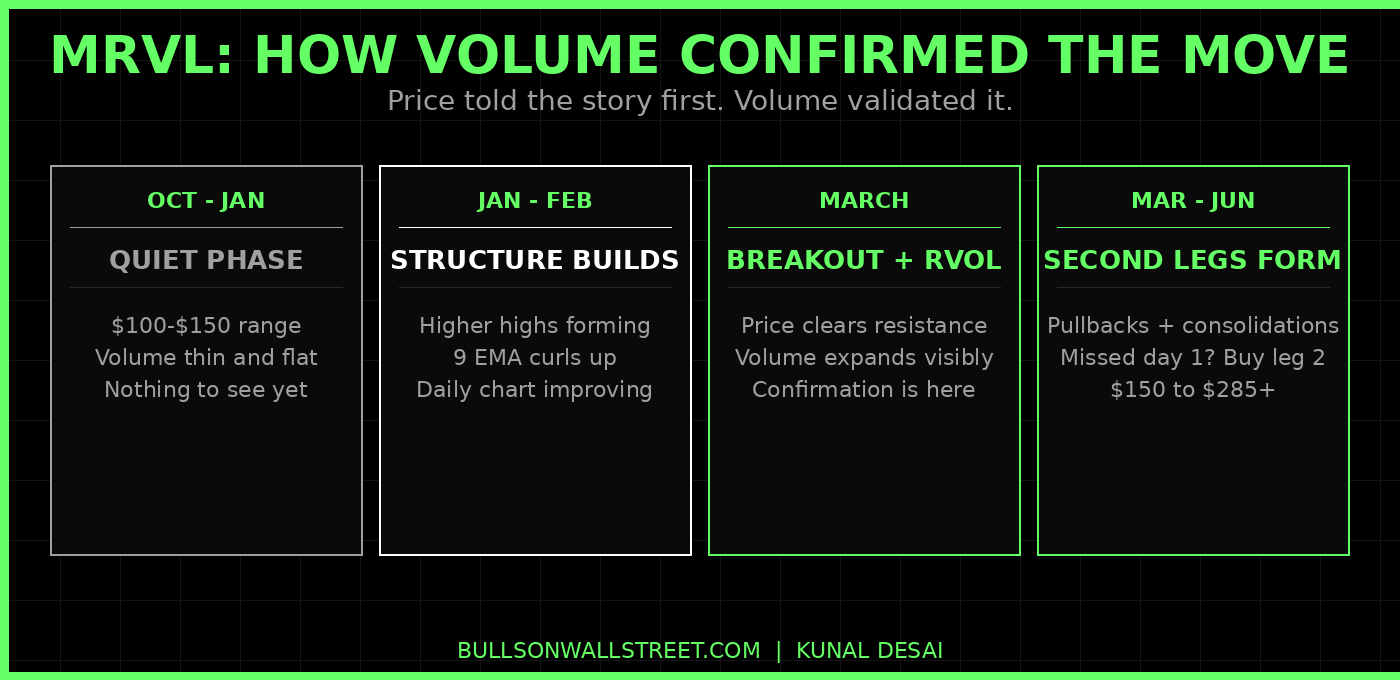
From October 2025 through early January 2026, MRVL was a quiet stock. Volume was thin. Price drifted in a range around $100-$150. Nothing about the volume numbers would have told you this was worth watching. There was nothing to see.
Then in late January and through February, the price structure started changing. The daily chart began showing a series of higher highs and higher lows. The 9 EMA curled up through the 20 EMA. A technical story was forming -- before the volume said anything interesting.
By March, when MRVL broke above key resistance and started its real move, the volume expanded visibly. The daily bars got taller. Green days came on volume well above the 50-day average. That expanding relative volume was the confirmation that the breakout had institutional buying behind it -- not just a one-day pop.
MRVL ran from roughly $150 to $285+ by mid-June 2026. That is an 89% move. The volume did not predict that run. The price pattern predicted it. The volume confirmed it had legs.
Here is the part most traders miss: you did not need to catch day one to profit from this move. If you missed the initial breakout, the right move was to do your nightly scan, see the expanding volume relative to the prior months, recognize the accumulation pattern on the daily, and wait for a consolidation. MRVL gave multiple pullback entries as it climbed. You get the second leg with full confirmation in hand. That is a higher-probability entry than buying a breakout on day one before you have any of that data. You can learn more about how I scan for setups like this in my post on scanning for explosive stocks.
The Opening Candle: The One Time Volume Gives a Real-Time Signal
There is one situation where volume gives you actionable information in real time, not after the fact: the opening 5-minute candle.
When a stock trades a significant portion of its average daily volume in the first 5 minutes, that is a signal worth paying attention to. A name that normally does 2 million shares a day and trades 500,000 shares in the first 5-minute candle is telling you something. Institutional participation is heavy. The stock is on a lot of desks. The day has momentum behind it.
This does not mean you buy it blindly because the first candle is big. It means the opening candle volume is a filter on top of the price pattern you already identified in your pre-market scan. You identified the setup the night before or early that morning. The first candle confirms the interest is real, not manufactured.
Per FINRA guidance on market participation metrics, unusual volume concentration at the open is one of the most reliable indicators of informed trading activity. That tracks with what I see every day at 9:30. The names with outsized opening candle volume are the ones drawing the most attention from experienced participants -- which is exactly the environment where momentum setups have the highest follow-through rate.
Compare it to the opening candle on a quiet day for the same stock. That is your baseline. That contrast -- big opening candle versus thin opening candle -- is what I am reading when I review my pre-market gapper list. I want to see real volume at the open, not a thin pop that fades in the first 10 minutes.
What Traders Get Wrong About High-Volume Stocks
There is a pattern I see repeatedly with new traders. They filter for highest volume on the day and assume those are the best plays. The logic sounds reasonable on the surface -- high volume means high interest, right?
Here is the problem. A stock doing 100 million shares by noon already made its move. The gap-and-go happened at 9:32. The opening range breakout already ran. The early pullback already bounced. Anyone who traded it well got in before the volume number was impressive. By the time the stock shows up on a mid-day volume screener, you are looking at the aftermath, not the setup.
The better question is not which stocks have the most volume right now. The better question is which stocks are showing expanding volume relative to their own history -- and whether that expansion is happening at the same time as a price pattern that has technical merit.
That is a completely different filter. It requires you to look at the daily chart first, build a watchlist the night before, and understand what each stock's normal volume range looks like. Then, when volume expands above that baseline as price breaks a key level, you have a case worth building.
If you want to see how I build the daily watchlist and run the actual scans, check out my post on what relative volume means and why RVOL alone is not a buy signal -- it goes deeper on the RVOL calculation and common misreads.
Putting It Together: The Correct Sequence
Here is how volume actually fits into a trade decision, in order:
Night before: Run your daily scans. Filter for stocks with the right price range and average volume for your account size. Look at the daily chart. Is there a technical setup forming -- a base, a flag, a flat top near resistance? Is the stock in accumulation on the daily (up days on heavier volume, down days on lighter volume)? That is your watchlist for tomorrow.
Pre-market: Which names on your watchlist are gapping with a catalyst? Earnings beat. FDA approval. Analyst upgrade. Sector news. A catalyst plus a clean daily chart is the setup you are looking for. No catalyst can still work for swing trades, but catalyst plus pattern is the highest-probability version.
Market open: Watch the first 5-minute candle on your top names. Is the opening volume proportionally large relative to that stock's normal pace? That tells you whether the day has institutional participation behind it. It does not tell you where to buy. Your setup and your risk point tell you where to buy.
On the breakout: Volume should expand above the average as price clears the key level. That expanding relative volume is the confirmation that validates the move. If the stock breaks out on thin volume, the move is suspect. Wait for volume to confirm or skip the trade entirely.
On the consolidation: Low volume is your friend. A flag forming on quiet tape is a stock coiling. When volume picks back up on the next breakout attempt, that is the entry signal -- and if you missed day one, this is your second chance with full evidence in hand.
For the risk management side of this -- how much to size, where to put your stop, when to take the first profit -- my risk management hub covers the complete framework including the 1% Rule and the Free Trade method I use to trail winners.
The VWAP indicator pairs directly with volume reads at the open -- when a stock holds above VWAP on expanding volume in the first hour, that is a strong signal the trend is real for the day.
FAQ: How to Use Volume in Trading
Does high volume mean a stock is a good buy?No. High volume means a lot of shares traded, which confirms there is liquidity and interest. It does not mean you should buy. A stock can do 200 million shares on a distribution day where institutions are selling into retail buyers. Volume without a price pattern and directional context tells you nothing actionable.
What is relative volume and why does it matter more than absolute volume?Relative volume compares today's volume to the stock's own historical average. A stock doing 10 million shares on a day when it normally does 1 million has 10x relative volume -- that is highly significant. A stock doing 10 million shares when it normally does 8 million is barely above average. The absolute number means nothing in isolation. The expansion relative to the baseline is what matters. See my full breakdown of relative volume here.
What does low volume during a consolidation mean?It is usually a positive sign. When a stock is flagging or consolidating and volume dries up, it means sellers are not attacking the stock. Weak hands have already sold. The stock is resting, not breaking down. When volume expands again on the next breakout attempt, that contrast is exactly the confirmation you want to see.
Can I use volume to predict when a stock will break out?No. Volume confirms after the fact. You cannot look at today's volume and know a stock is about to move tomorrow. What you can do is study the daily chart for a technical setup that suggests a breakout is building -- a flat top, a tight flag, a multi-week base -- and then use volume expansion on the actual breakout day as confirmation that the move has real buyers behind it.
What does the opening 5-minute volume tell me?It tells you whether institutional participation is elevated on that name for that day. A stock that trades 20-25% of its average daily volume in the first 5-minute candle is drawing serious attention. That does not mean buy it blindly -- it means the stock deserves to be on your active watchlist for the morning and your price pattern entry is more likely to have follow-through behind it.
What is accumulation vs. distribution in volume analysis?Accumulation means the stock is closing up on above-average volume -- institutions are buying. Distribution means the stock is closing down on above-average volume -- institutions are selling. Over a series of days on the daily chart, this pattern tells you whether the big money is building a position or unloading one. You want to trade in the direction of accumulation.
If I missed a breakout, is the trade over?Not necessarily. Many of the best entries come on the second leg, not the first day. If you missed the initial breakout, watch for the stock to consolidate on declining volume. That tight consolidation -- a flag, a shallow pullback, a pause -- gives you a second entry with full confirmation in hand. You have the expanding volume from the initial move, the price pattern from the daily chart, and the consolidation showing sellers are not in control. That is often a higher-probability entry than chasing day one.
How do I scan for stocks with expanding volume?I run my pre-market gapper scan and my liquid gainers scan every morning using TC2000. The filter is simple: price between $5 and $100, average volume above 1 million shares, and relative volume above 2x normal on the day. That gets me down to a focused list of names with real activity. From there, I look at the daily chart of each name to see if the volume expansion is happening at a technically meaningful level -- a breakout, a flag, a base. Scanner first, chart second, volume as confirmation. Never the other way around.
Does volume work the same way for swing trading as it does for day trading?The principle is identical. Price pattern first, volume confirmation second. For swing trading, you are reading the daily chart accumulation/distribution pattern over weeks. For day trading, you are reading the 5-minute chart in real time and watching whether the opening candle volume and subsequent bars confirm the intraday pattern. The timeframe changes. The logic does not.
What is a volume dry-up and why is it significant?A volume dry-up is when a consolidating stock's daily volume contracts significantly below its average -- sometimes to a fraction of normal. It means the market has temporarily lost interest. No aggressive sellers, no aggressive buyers. The stock is compressing. Historically, periods of extreme low volume often precede significant directional moves, because the tension of buyers and sellers reaching equilibrium tends to break one way or the other. A breakout from a volume dry-up on suddenly expanding volume is one of the cleaner setups in the game.
Kunal Desai is the CEO and founder of Bulls on Wall Street. A professional trader since 2007, he has navigated every major market cycle -- from the 2008 financial crisis to today's high-volatility environments. Having mentored 7,000+ students through his live trading bootcamps, Kunal trades live every morning in the Bulls on Wall Street Trading Chatroom, where a full-access 7-day trial costs $7. He is dedicated to teaching real-world execution and high-probability strategies. Based in Miramar Beach, Florida.
Learn Volume, Price Action, and Every Setup I Trade
If you want to learn how I actually read volume in real time -- alongside price patterns, scanners, and risk management -- the 60-Day Trading Bootcamp covers the full system. 7,000+ students have gone through it. It is live, it is intensive, and it is built around real execution, not theory.