

An opening range breakout, or ORB, is a day trading setup where a stock establishes a high in the first candles of the session, holds below it, then breaks above that level to signal momentum continuation. That is the textbook definition, and it is accurate as far as it goes.
Here is the problem. That definition has convinced a generation of new traders that any green push through the morning high is a buy, and that mistake gets paid for at 9:32 AM every single day. I have been trading since 1999, full time since 2007, and I have taught the opening range breakout to more than 7,000 students at Bulls on Wall Street since 2008. Every chart in this post is from the same trading morning I wrote it. Let me give you the version of the ORB that the dictionary sites cannot.
The Facts Up Front
An opening range breakout requires four things. A daily chart that supports the trade, meaning the stock is breaking out of range with a catalyst and no overhead supply, not finishing an extended run. A pop at the open that establishes the opening high. A true lid, meaning every subsequent candle holds at or below that opening high in a tight range. And a break of that lid, bought no earlier than the third candle on a 5-minute chart, which is the 3-Candle Rule. Stop goes under VWAP. First profit target is 3 to 1 reward to risk. The guiding principle of the whole pattern: the longer the base, the higher the space.
Why the Time Frame Argument Matters
Ask ten traders what chart to run an ORB on and you will start a fight. The old school professionals I came up around used 15-minute candles and would not touch the trade until a 15-minute range broke. Higher probability, no question, because more time in the range means a stronger base. The cost is brutal though. In many markets the majority of the day's volatility happens in the first 30 minutes, and the research agrees, with studies of NASDAQ trading from 2000 through 2021 showing volume and activity concentrated hardest around the open in a pronounced U-shape pattern you can read about on SSRN. Waiting for a 15-minute range to form and break means sitting out the most explosive stretch of the morning. I read all the books that said sit out the first half hour and let the ranges develop. I was never a believer, because the move I came for kept happening while those guys were still waiting.
The other extreme is the 1-minute and 2-minute crowd. Those charts give you precision entries with tight risk, and if you are scalping for 10, 30, 50 cents, they work. The tradeoff is fakeouts everywhere, a win percentage that drops, and a zoom level that makes a 20 cent pop look parabolic. You start seeing patterns in pure noise.
My answer is the 5-minute chart, and it has been for nearly two decades. The chart is visually clean. The range is meaningful, because a 5-minute ORB means a minimum of three candles, and the earliest buy is on the third candle, so you are looking at ten-plus minutes of real range instead of three minutes of noise. Sometimes the range takes five or six candles to develop, and that is fine, longer base, higher space. And you are still participating in the open instead of watching it. On a 5-minute ORB in a higher priced name I might hold for a 5 or 10 dollar move, because the internal zigzag that shakes people out of 1-minute charts mostly disappears.
The Anatomy: Pop, Lid, Coil, Break
This is the part almost everyone gets wrong, so read it twice. An opening range breakout has to have a literal pop at the open and then a lid. The opening candle drives up and establishes the high. Then every candle after it holds AT or BELOW that high, coiling tight underneath it. That opening high is a true line in the sand, and it should be obvious. You should not have to tilt your head and close one eye to find the opening range. If you are squinting, there is no range.
Students tell me all the time they thought the pattern meant see three green candles and buy. No. A loose staircase of little candle up, little candle down, drifting higher, is not an opening range breakout. There is no lid, there is no coil, there is no stored energy. There is just movement. The break only means something when there was a ceiling the stock had to fight through.
The Three Ways Traders Blow This Trade
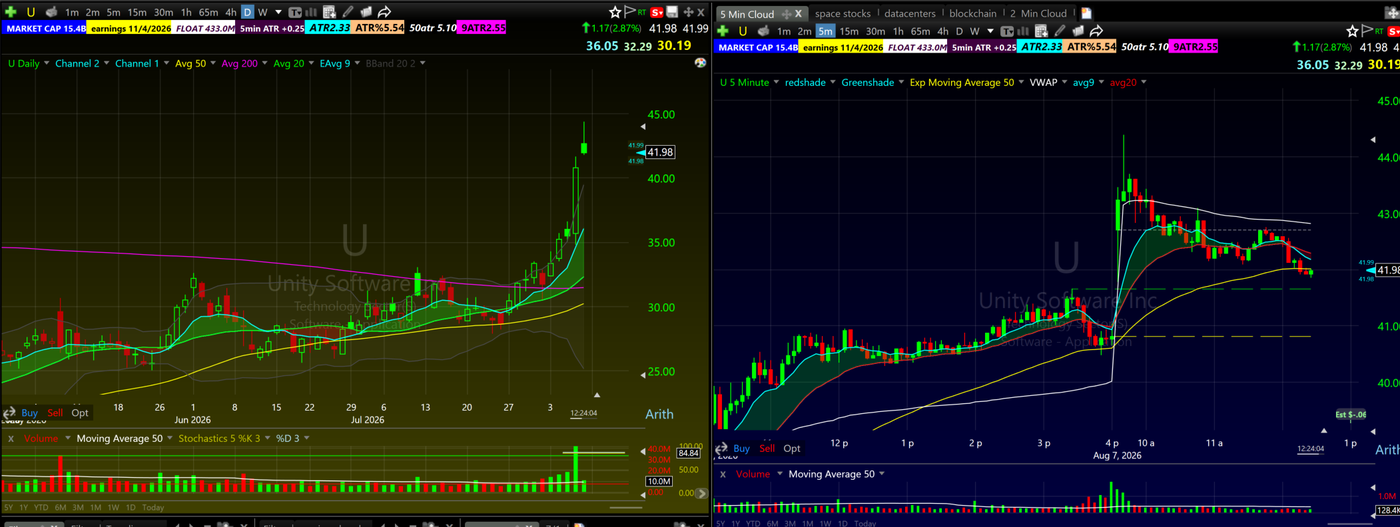
Mistake one: buying the second candle. The second candle pushes through the opening high, everyone wakes up, everyone buys, and the stock pulls right back in. Fakeout. This is exactly why the 3-Candle Rule exists. The earliest entry is the third candle, minimum, because the range needs time to become a range. This morning, Unity Software gave a textbook demonstration, pushing the range on candle two and reversing on everyone who chased it.
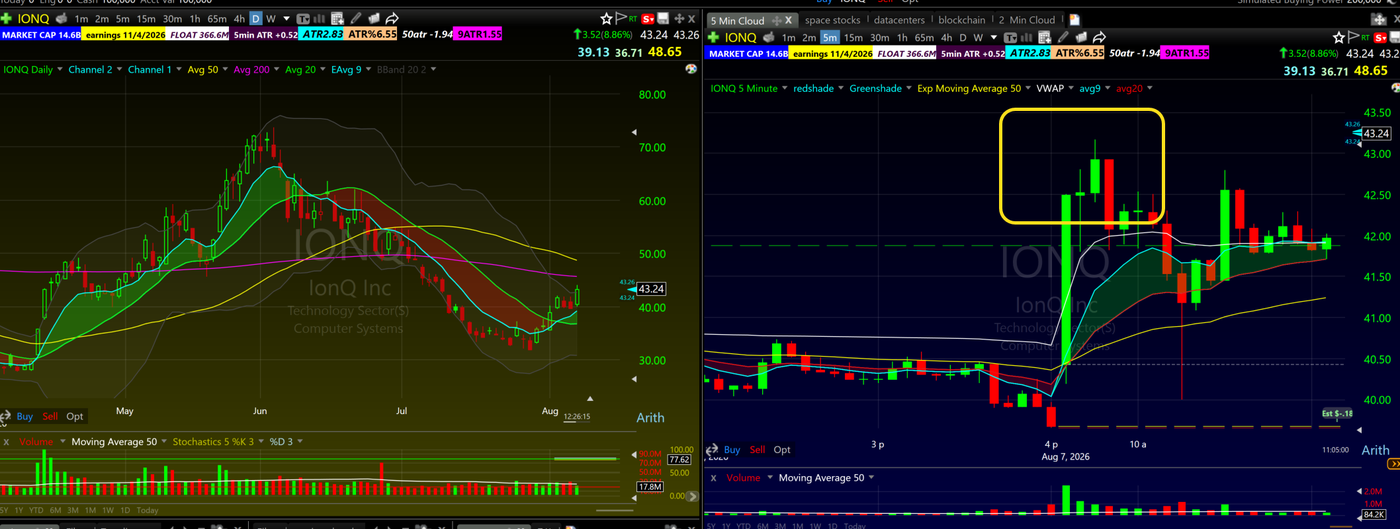
Mistake two: trading a stock with no lid. Same morning, IONQ was running hot and traders were forcing the ORB label onto a loose sequence of candles that never built a ceiling. Strength alone is not a setup. If the opening high is not capping the subsequent candles, you are not trading a breakout, you are chasing drift.
Mistake three, and it is the deepest one: forcing the ORB onto the wrong stock. The opening range breakout is a two-chart pattern, and the daily chart holds veto power before the intraday setup even matters. Unity is the example again. On the day of that fakeout it was up five days in a row, seven dollars above its 9 EMA on the daily, outside the upper Bollinger Band with overbought stochastics. Every exhaustion tell on the sheet. But the stock looked strong, so people tried to buy the open anyway. An extended daily chart turns a valid intraday pattern into a donation. I cover how I read these daily structures in my stock chart patterns guide, and it starts with candles, which is why every new trader gets our free candlestick patterns PDF before anything else.
What the Quintessential ORB Looks Like
Twilio, the same morning as both failures above. Start with the daily: TWLO reported earnings the night before and gapped up over 30 percent, a 29 billion dollar company clearing its entire range. Look left on the daily and there is nothing overhead, no supply, no trapped sellers, clean air. That is a candidate.
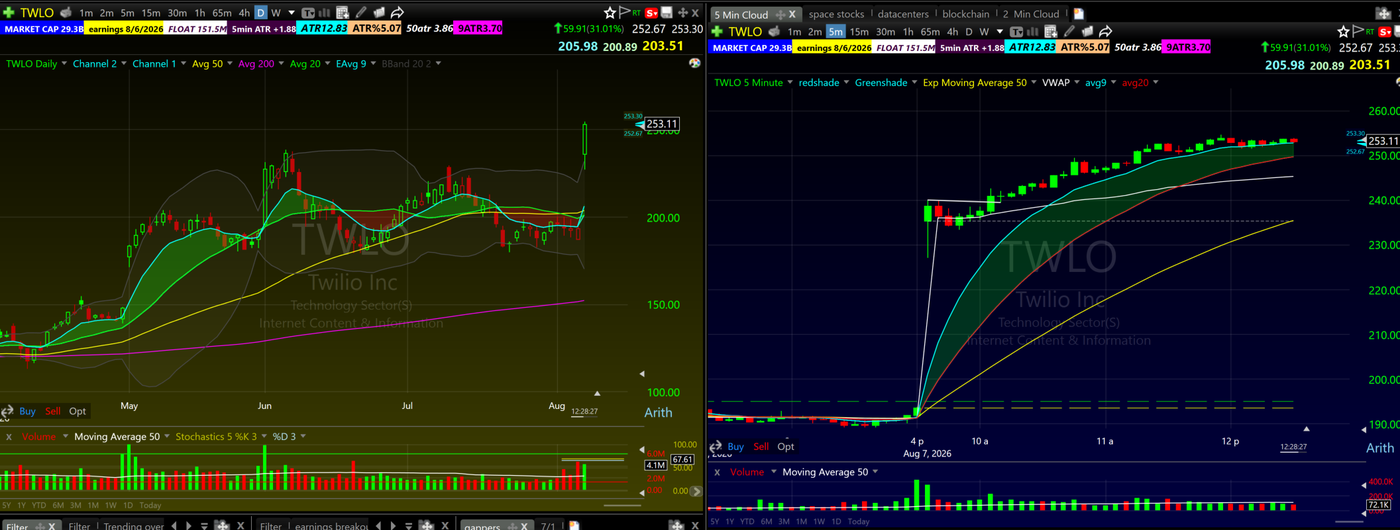
Then the intraday. The opening candle established a high, and the level was obvious, a true line in the sand you could see from across the room. The stock coiled under it. When price finally crossed over the opening range, that was the entry, and the stop went under VWAP, which is how I manage every one of these and why understanding VWAP is non-negotiable for this trade. From there the management is simple. When the trade reaches 3 to 1 reward to risk, I look to sell some. Not have to, look to. From there you can ride the Bone Zone higher and turn the position into a Free Trade, or do what I usually do, take a piece off and let the EMAs walk the rest up to extract the last bit of the move. The full entry and management playbook lives in my opening range breakout strategy guide, and the sizing math behind that stop placement is covered in the risk management hub.
One more thing about that opening print itself. The open is not just a timestamp, it is a single-price auction where the exchange matches the entire overnight order book at once, which is why the first candles carry so much information. The NYSE publishes exactly how the opening auction works, and academic work on opening procedures shows how much of the early volume concentrates in that first matched trade. The opening range is the market digesting that auction in real time. That is why the pattern exists at all.
I chart all of this on TC2000, daily and 5-minute side by side, same layout you see in every screenshot in this post.
Opening Range Breakout FAQ
What is the opening range in stocks?
The opening range is the high and low established by the first candles of the regular session. For my trading that means the first three to six candles on a 5-minute chart, roughly the first 15 to 30 minutes. The high of that range is the breakout level.
What is the best time frame for an opening range breakout?
The 5-minute chart is the best balance for most traders. One and 2-minute charts give precision but endless fakeouts. Fifteen-minute charts give probability but surrender the most volatile stretch of the day. The 5-minute gives a real range, a clean look, and participation in the open.
What is the 3-Candle Rule?
The earliest valid entry on a 5-minute opening range breakout is the third candle. A range needs a minimum of three candles to be a range. Second-candle breaks are where the fakeouts live, because the pattern has not stored any energy yet.
Where do you put your stop loss on an ORB?
Under VWAP. If a real opening range breakout loses VWAP, the momentum thesis is dead and there is no reason to be in the trade.
Do opening range breakouts work on every stock?
No, and this is the most ignored rule of the pattern. The daily chart holds veto power. A stock that is up multiple days in a row, stretched far above its daily 9 EMA, or outside its upper Bollinger Band is exhausted, and forcing an intraday breakout pattern onto an exhausted daily chart is how strong stocks take your money.
What is an opening range breakdown?
The same pattern inverted for the short side. The opening candles establish a low, price coils tightly above it, and the break below that floor is the trigger. Same rules apply, including the daily chart veto and the 3-Candle Rule.
What is the difference between an ORB and a gap and go?
A gap and go buys strength immediately off the open with little or no base, and it sits alongside the ORB in my day trading strategies playbook. An opening range breakout demands the base first, the pop and the lid and the coil, then buys the break. The ORB trades patience for confirmation.
How should a beginner practice opening range breakouts?
In a simulator, not with real money. My bootcamp students do not trade live during the program at all. They learn the pattern, simulate it, and go live only when their simulator data proves they can execute it. The open is the fastest water in the market. Learn to swim somewhere shallower first.
Learn the Open From Someone Who Trades It Every Morning
The opening range breakout is simple to define and hard to execute, because the definition is one sentence and the judgment is twenty years. If you want to watch these setups traded live at the open, real account, real scans, every market morning, that is literally what I do inside the 60-Day Trading Bootcamp. Pop, lid, coil, break, stop under VWAP, and a mentor on the other side of the screen while you learn it. That beats squinting at a definition.
Kunal Desai is the CEO and founder of Bulls on Wall Street. A professional trader since 2007, he has navigated every major market cycle from the 2008 financial crisis to today's high volatility environments. Having mentored 7,000+ students through his live trading bootcamps, Kunal Desai trades live every morning in the Bulls on Wall Street Trading Chatroom and is dedicated to teaching real world execution and high probability strategies. Based in Miramar Beach, Florida.
Connect with Kunal: Read his full story | Instagram | YouTube