Seven years.
That is how long it took me. 1999 to 2006. Seven years of trading before I had my first consistently profitable year. Seven years before I felt like I actually knew what I was doing.
I started in college at 18. Forums, MSN Money, hot stock tips from whoever was talking loud that week. I had the hunger. I had the screen time. I just did not have a system. Not even close.
I graduated, got stuck in a headhunting job, and traded on the side for years in a spin cycle — a few good months, then the old habits would come back and I would give it all back. There were times I looked at charts and it was like reading Chinese. Nothing made sense. Then other times things would click and I would think, okay, I have a few patterns down, I can do this. Then I would lose it again.
That cycle is more common than anything the internet will tell you. Everyone online wants to give you a 6-12 month timeline with a tidy little graphic. The real answer is more complicated. And more useful.
After 25+ years of trading and watching 7,000+ students go through the 60-Day Live Trading Bootcamp, I have more data on this question than anyone writing about it. This post is the honest answer.
Why Every Timeline You Read Online Is Wrong
Search this topic and you will find post after post saying 6 months to a year. Some say 1-2 years. Most give you a neat little phase breakdown with arrows and checkmarks.
Here is why those timelines are mostly useless: they describe learning the mechanics. What to click, what a flag pattern looks like, how to place a stop loss. Mechanics can be learned in months.
Profitability is a different animal.
Profitability requires you to match your knowledge to market conditions, manage your psychology under real financial pressure, and build a system that works for you specifically — not someone else. That takes significantly longer than learning what a moving average is.
The traders who show up in forums claiming they got profitable in 3 months either got lucky in a strong market, are not being fully honest, or are outliers. FINRA research consistently shows that day trading is a high-risk activity and the data on retail trader failure rates is not encouraging. That is not a reason to quit before you start. It is a reason to understand the real timeline so you do not blow up because you expected profitability in 60 days.
The Three Phases Most Traders Actually Go Through
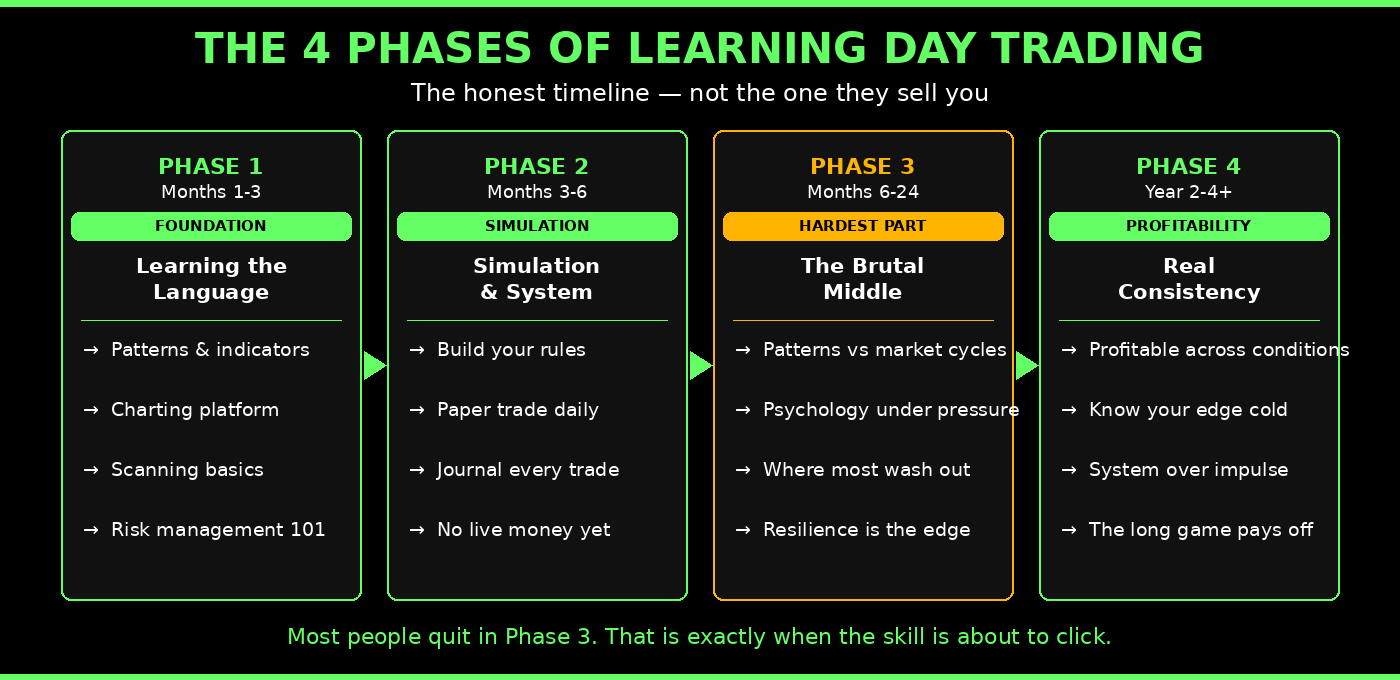
Phase 1: Learning the Language (Months 1-6)
This phase is about technical foundations. Chart patterns, moving averages, volume, scanning, risk management basics. You are building vocabulary. You are learning to see things in a chart that you could not see before.
This phase feels good. Progress is visible. Your confidence builds.
The trap in Phase 1 is confusing the ability to identify a pattern with the ability to trade it profitably. Seeing a bull flag on a chart and executing a bull flag trade in real time with real money under real psychological pressure are completely different skills. Phase 1 teaches you the first. The second comes later.
What to focus on: Learn one or two setups. Not ten. The first pullback strategy and the opening range breakout are where most developing traders should start. Master those before adding anything else.
Phase 2: The Brutal Middle (Months 6-24+)
This is where most traders wash out. And the reason is almost never what they think.
Phase 2 is where you have enough knowledge to take trades but not enough experience to know when NOT to take them. You understand the pattern. You do not yet understand market context. You do not yet know that a high tight flag that works beautifully in a runup market will fail repeatedly in a distribution phase.
I learned this the hard way in 2007. I had a pattern I was doing well on — high tight flags. Strong setups, good entries, consistent results. Then the market started to shift. You could feel weakness in stocks, though the mortgage crisis was not in the news yet. My go-to pattern started failing every single time.
My first instinct was that I was doing something wrong. It was only later that I understood the real lesson: patterns have to match the market cycle. There are four market cycles and each one has its own set of setups that work. A high tight flag requires a momentum market — a runup phase. In a distribution or downtrend, that setup has almost no edge. I was trading the right pattern in the wrong environment.
What to focus on: Study all four market cycles and which setups work in each. Keep a trade journal every single day. Use TC2000 to track market breadth so you understand what phase you are in before you pull a trigger.
Phase 3: Consistency (Year 2-3+)
This is where the work starts paying off. Not every month is green, but you know why the red months happen. You have a system. You have rules you actually follow. You understand your personal edge and the conditions that amplify or destroy it.
Most traders who make it to Phase 3 did one thing differently in Phase 2: they did not quit when it got hard.
The Real Turning Point: When I Met My Mentor
I mentioned the spin cycle. Making money, giving it back, making it again. Years of that. Then I found Paul Singh through the Market Speculator blog and started leaving comments. Eventually he started working with me via AOL Instant Messenger in late-night sessions.
The shift was immediate. Day one I started connecting dots I had never connected before. Not because Paul taught me new patterns — I had seen most of them. He taught me something more important: that trading is a system, not just pattern recognition.
Before Paul, I could spot momentum. I always had a knack for identifying stocks that were moving. But I had no actual process for what to do once I identified one. No checklist for the exact entry. No defined stop loss placement logic. No position sizing formula. No written rules for how I would manage the trade once I was in it.
I was winging it every single time. And the thing about winging it is that sometimes it works, which actually makes it worse because it reinforces the behavior. What Paul gave me was structure. A framework that turned trading from an art into a discipline. The same setup, the same rules, the same decisions, every single time.
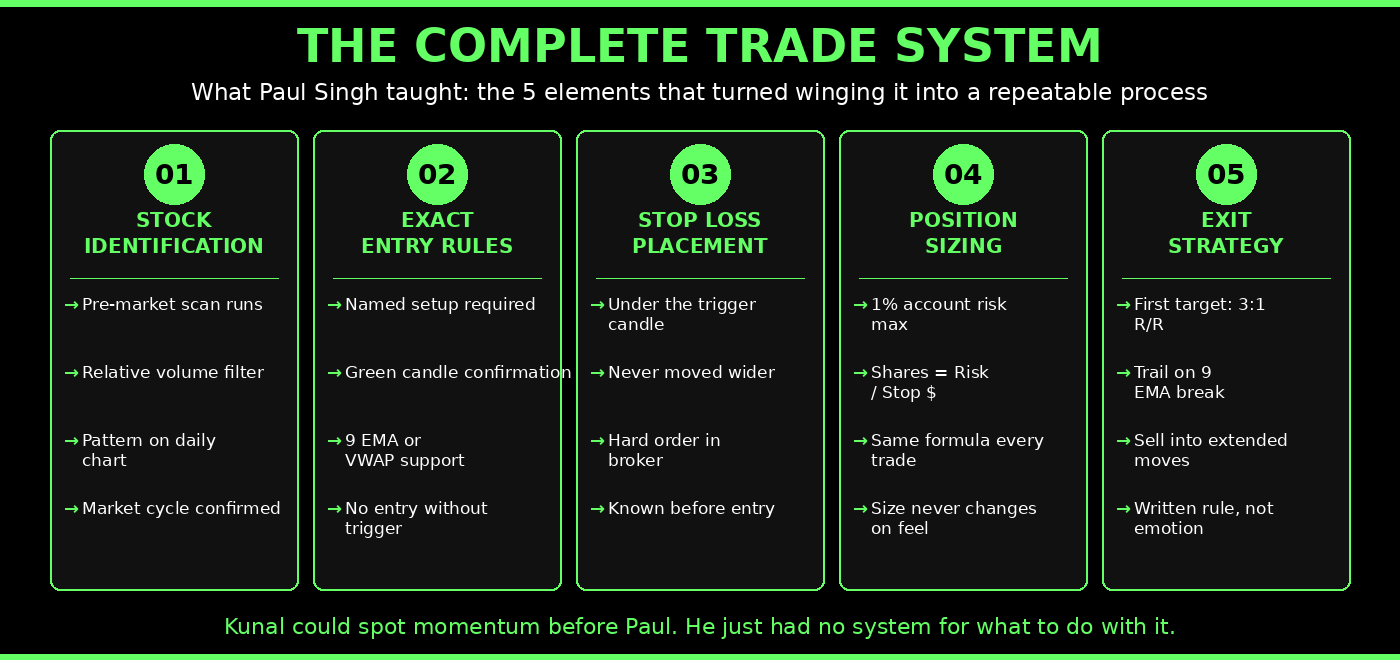
This is also exactly why the 60-Day Bootcamp is structured the way it is. You do not trade live during the program. You learn the system first, then simulate, then build a business plan, then watch live trading in the chatroom, then go live when your data says you are ready. The order matters.
The Market Cycle Lesson Nobody Talks About
This deserves its own section because it is the mistake that gets more intermediate traders than anything else.
When you learn a pattern and start seeing success with it, your brain labels that pattern as reliable. You build confidence in it. The problem is that most patterns only work in specific market cycle conditions.
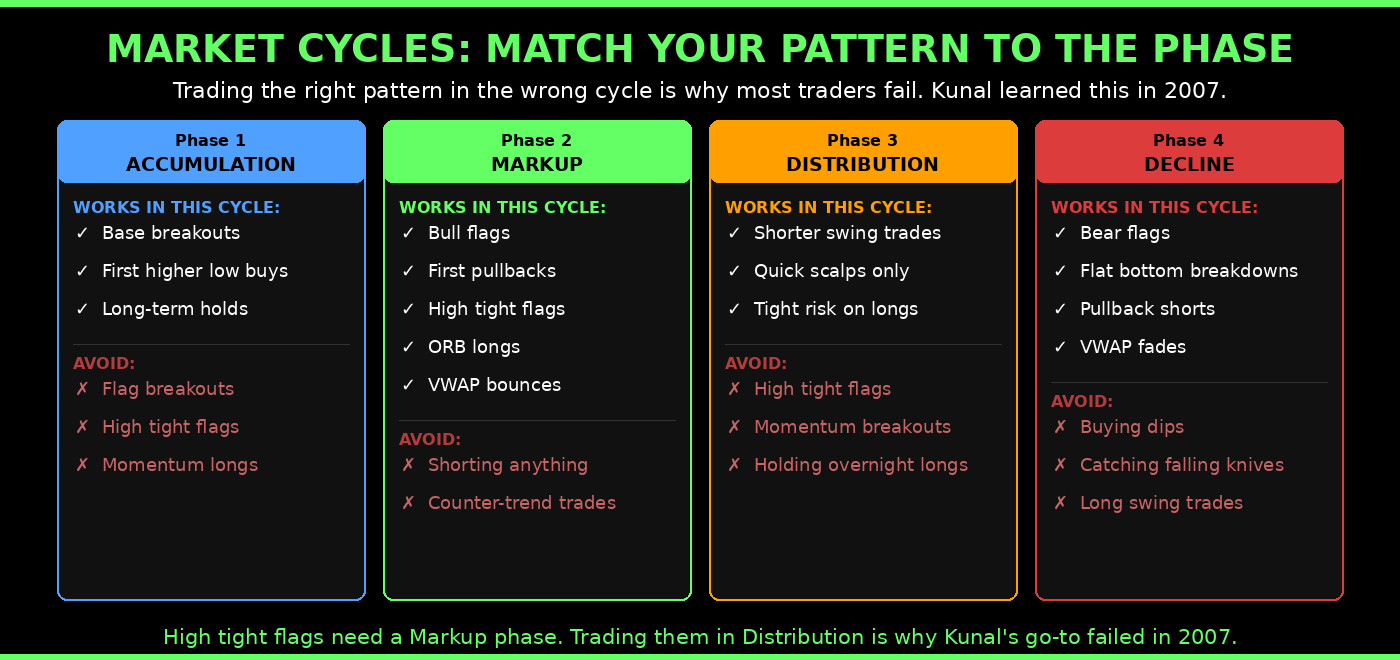
The four phases — accumulation, markup, distribution, decline — each reward different setups. A momentum strategy like a high tight flag or a flag breakout needs a runup phase with expansion in volume and broad market strength. Try to force those setups into a distribution phase and they will fail you every time. Not because you are executing poorly. Because the conditions do not support the pattern.
This is why studying market breadth is not optional. Every morning before I trade I look at the percentage of stocks above key moving averages, sector strength, and overall QQQ direction. A trader who ignores market cycle and just runs their favorite pattern regardless of conditions will have an unexplainably inconsistent win rate. Watch how I read the market every morning on the YouTube channel at youtube.com/@kunaldesaitrading.
What 7,000 Students Taught Me About Who Makes It
After 7,000+ students I have a very clear picture of what separates the traders who eventually get profitable from the ones who wash out. It is not intelligence. It is not how much they already knew coming in. It is not even how fast they learn the patterns.
It is resilience.
The traders who make it are the ones who show up when the chips are down and do the boring work anyway. When you are making money it is easy to run your scans, do your journal, stay disciplined. The real test is what you do in a slump.

The second thing the traders who make it all share: genuine passion for the process. Not just for the money. If you do not love trading at least a little, when you hit a rough patch there is nothing to pull you back to the desk. The preparation becomes a chore. The journal gets skipped. Without passion for the craft, the discipline falls apart at exactly the moment you need it most.
How to Actually Shorten the Learning Curve
You cannot skip the timeline. But you can accelerate it.
Learn one setup completely before adding a second. The traders who try to learn everything at once learn nothing. Pick the first pullback, the ORB, or the VWAP bounce. Run it for 60-90 days until you can explain every entry, every stop, every exit without thinking. Then add a second setup.
Get a mentor or structured program. The difference between my first 6 years of trading alone versus what happened when Paul Singh started working with me is not subtle. A good mentor collapses years of trial and error into months by pointing out what you cannot see yourself.
Trade the simulator longer than you think you need to. Most people rush from simulator to live trading the moment they have a few good simulator weeks. The simulator builds behavioral habits. You want those habits so deeply ingrained that when real money stress enters the equation your body already knows what to do.
Journal every trade, every day, without exception. The traders who build a real edge are the ones who have data on their own behavior. Which setups perform best for them specifically. Which market conditions match their style. What time of day they execute best. You cannot know any of this without a journal.
Use the right charting platform from day one. TC2000 is what I have used for nearly 20 years. Download the full TC2000 layout here to get started with the exact setup I use every morning.
Risk 1% per trade maximum during development. Blowing up your account ends your trading career before your skill catches up to your potential. The position sizing calculator tells you exactly how many shares to take based on your account size and stop distance.
The Honest Timeline Table
| Phase | Timeline | What You Are Learning |
|---|---|---|
| Mechanics | Months 1-3 | Patterns, indicators, platform, scanning |
| Simulation | Months 3-6 | Execution, discipline, system-building |
| Early live trading | Months 6-18 | Psychological pressure, rule-following under stress |
| Developing consistency | Year 1.5-3 | Market cycle reading, pattern-condition matching |
| Real edge | Year 2-4+ | Repeatable profitability across different market conditions |
These are ranges, not guarantees. A trader who goes through a structured bootcamp, journals every day, and has a mentor will move through these phases faster than a trader who is self-teaching from YouTube videos with no accountability.
FAQ: How Long Does It Take to Learn Day Trading
How long does it take to learn day trading?
The honest answer is 2-4 years to develop a real, consistent edge across different market conditions. You can learn the mechanics in 3-6 months. Profitable execution under live market conditions with real psychological pressure takes significantly longer. The traders who tell you they got profitable in 60 days either got lucky in a strong market or are not measuring profitability across enough market cycles to know if the edge is real.
Can you learn day trading in 6 months?
You can learn the foundations in 6 months. Patterns, scanning, risk management, basic execution. Consistent profitability in 6 months is possible for a small percentage of traders — typically those with prior finance backgrounds, access to a structured program, and a very disciplined daily routine. For most people starting from zero, 6 months builds the vocabulary. The fluency comes later.
What is the hardest part of learning day trading?
Not the patterns. The psychology. Specifically, following your rules when a trade is going against you and every instinct says to hold on or average down. The patterns can be memorized. Executing them calmly under financial pressure while a position moves against you takes months of real experience to build.
Does a trading course actually speed up the learning process?
A structured program with live mentorship compresses years of trial and error into months. The key word is structured — with rules, accountability, and someone reviewing your actual trades. The difference between how long it took me trading alone versus what happened once Paul Singh started working with me is not subtle.
How do I know when I am ready to trade live?
When your simulator data shows consistent positive expectancy over at least 60 trading days across different market conditions. Not just a few great weeks in a strong tape. You want to see that your system holds up when the market is choppy, when your setups are not working, and when you are in a losing streak.
What percentage of day traders become profitable?
The data is not encouraging for traders who go about it without structure. Academic studies consistently show that a large majority of retail day traders lose money over multi-year periods. The CBOE provides educational resources on derivatives markets that give context on how professional market participants operate versus retail.
What is the Bone Zone and why does it matter for new traders?
The Bone Zone is the area between the 9 EMA and 20 EMA on a chart. For developing traders it gives a simple, objective entry signal: when a trending stock pulls back into the Bone Zone on decreasing volume and then prints a green candle, that is the entry. It removes subjectivity from one of the hardest parts of trading — knowing exactly when to pull the trigger.
Why do most traders fail?
After teaching 7,000+ students, the answer is almost never that the market is impossible or that the patterns do not work. It is almost always one of three things: no written system so behavior is inconsistent, risk management that allows single trades to do permanent damage to the account, or quitting during the Phase 2 slump before the skill development catches up. For more detail on how professional risk management works, read the risk management guide.
How do I build resilience as a developing trader?
Show up every day regardless of how the P&L looks. Run your scans. Do your journal. Study a chart. Read something that makes you better. The traders who make it are not the ones who never have bad months. They are the ones who treat a bad month as data, not defeat.
Start the Right Way
The learning curve is real. But it is not random. Traders who go through a structured program with live mentorship, daily accountability, and access to someone trading real money in real time move through the phases faster and with fewer blowups.
That is exactly what the 60-Day Bootcamp is built to deliver. Six decades of live sessions, daily trading alongside me, a full system for scanning, entry, risk management, and exit — and no live trading until your simulator data says you are ready.
7,000+ students have gone through this process. The ones who make it are not the ones with the most prior knowledge. They are the ones who stay disciplined when it is hard.
Apply to the 60-Day Bootcamp here.
About the Author
Kunal Desai is the CEO and founder of Bulls on Wall Street. A professional trader since 2007, he has navigated every major market cycle -- from the 2008 financial crisis to today's high-volatility environments. Having mentored 7,000+ students through his live trading bootcamps, Kunal trades live every morning in the Bulls on Wall Street Trading Chatroom and is dedicated to teaching real-world execution and high-probability strategies. Based in Miramar Beach, Florida.
Connect with Kunal: Read his full story | Instagram | YouTube