$UNXL is one of those momentum names that had a tight flag triangle pattern on the daily chart. So I was eying it for a trade today. On the 10 minute chart, see that how it bounced off that uptrend line multiple times? This is the type of high-beta stock that is better to buy on a pullback rather than on a breakout.This morning it opened right on that trend line. Knowing that this area has been acting as support, I went long at $17.45 and sold all my shares at $18.40 for decent, quick gain. Later in the day, the stock breaks down that same trend line that was acting as support and gets crushed completely.
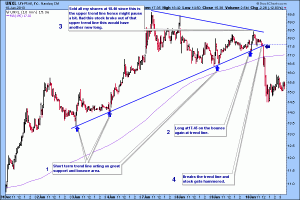
Click on the chart to see how it played out:1.Short term trend line acting as great support and bounce area2. Long at $17.45 on the bounce again at the trend line3. Sold all my shares at $18.40, since this is the upper trend line, hence might pause a bit. Had this stock broken out of that upper trend line, this would have another new long4. The old, reliable trend line breaks and the stock is hammeredEmail me thenyctrader@gmail.com if you would like to trade with us or have any questions.