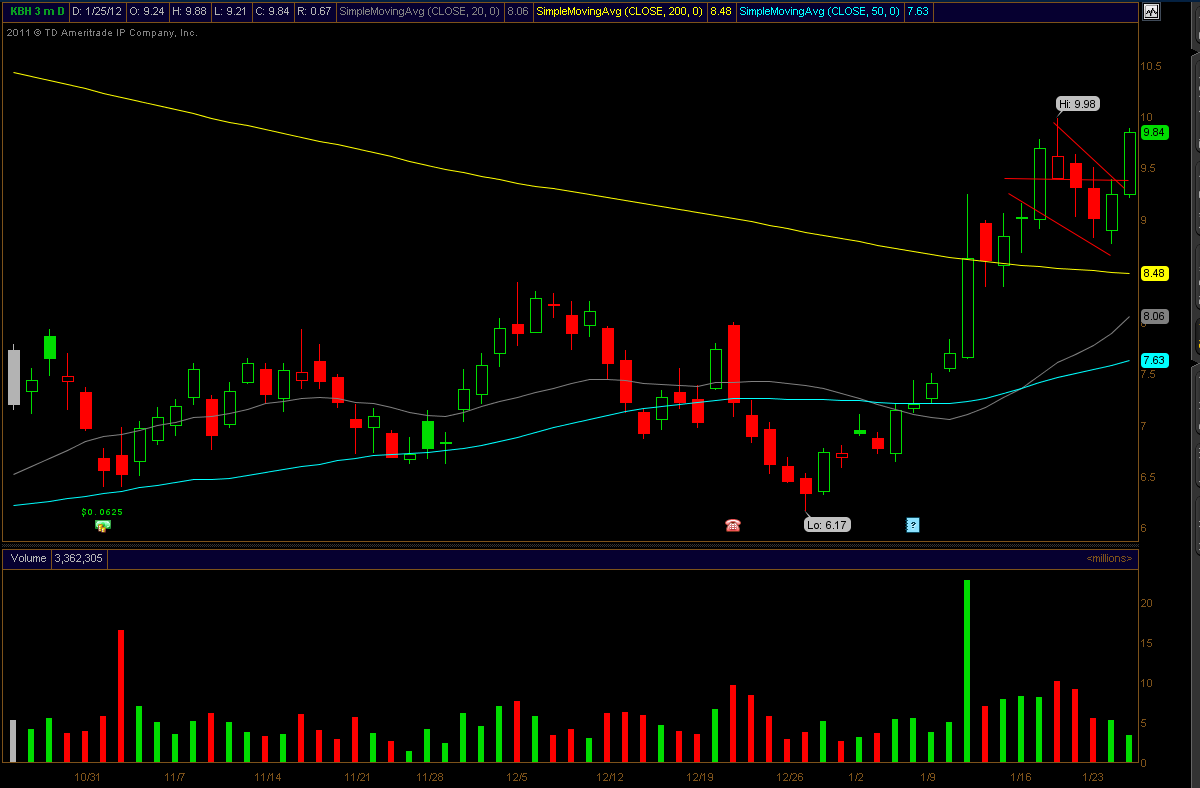
In this trade review we will cover how to trade flags. This was on last night's watchlist and we took the trade for about 40 cents in profit. When you see a pattern like this, you wait for the stock to break the trend. We had a perfect entry on this at $9.44 right as the flag was starting to break. As is typical of breakouts, the stock re-tested the breakout spot intraday and then bounced perfectly from there. If you stopped out at $9.4 then you sold right at the bounce spot; for the trade to have been a failed breakout, you would want to see that $9.4 area break.Here is a look at the 6 month chart that I used in the watchlist to find the setup

Here is a look at the intraday chart. Note how it re-tested the bust out spot ($9.4) then went straight up to 10 bucks.
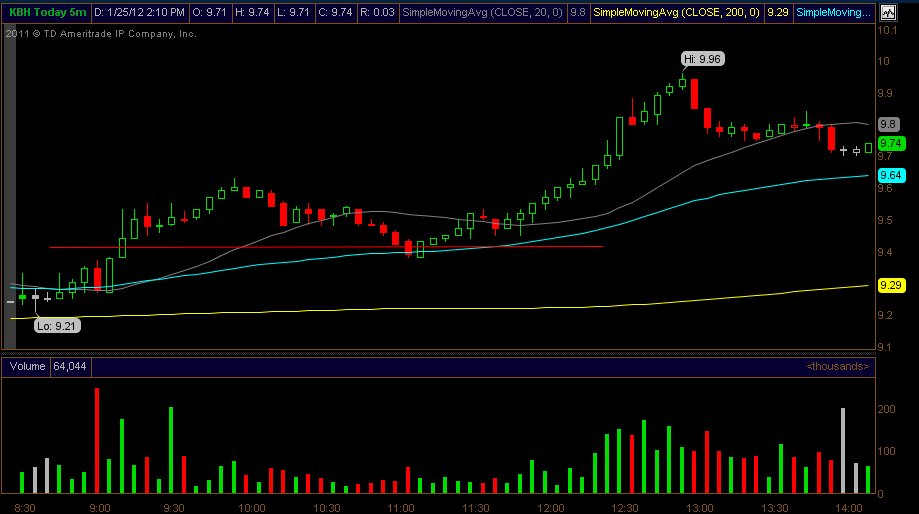
Here is a look at today's chart, with the $9.44 entry (chart is zoomed in a bit so you can see exactly where the breakout would occur)
If you'd like to learn how to recognize and trade these setups, shoot me an email at maribeth@bullson.ws today and I'll answer all your questions!