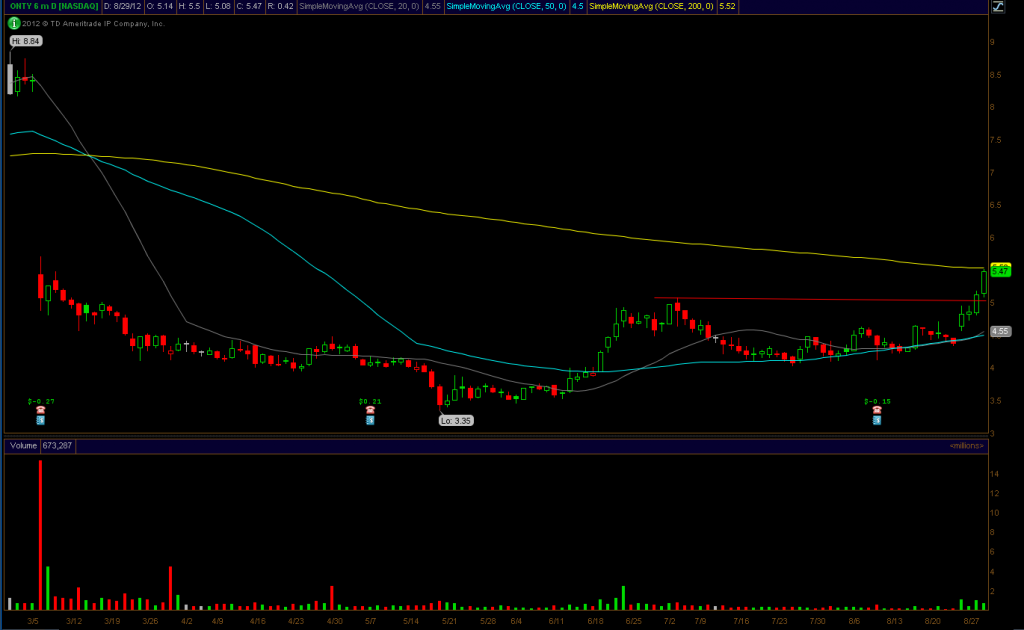
Yesterday we made a quick trade in $ONTY. I wanted to highlight how aligning stocks on multiple time frames works, as its an important concept for all traders to grasp.If you view the daily chart of $ONTY, you see that it has a very nice setup with an apparent breakout spot somewhere near $5. But where exactly should you get in? That's when you turn your attention to multiple time frames.
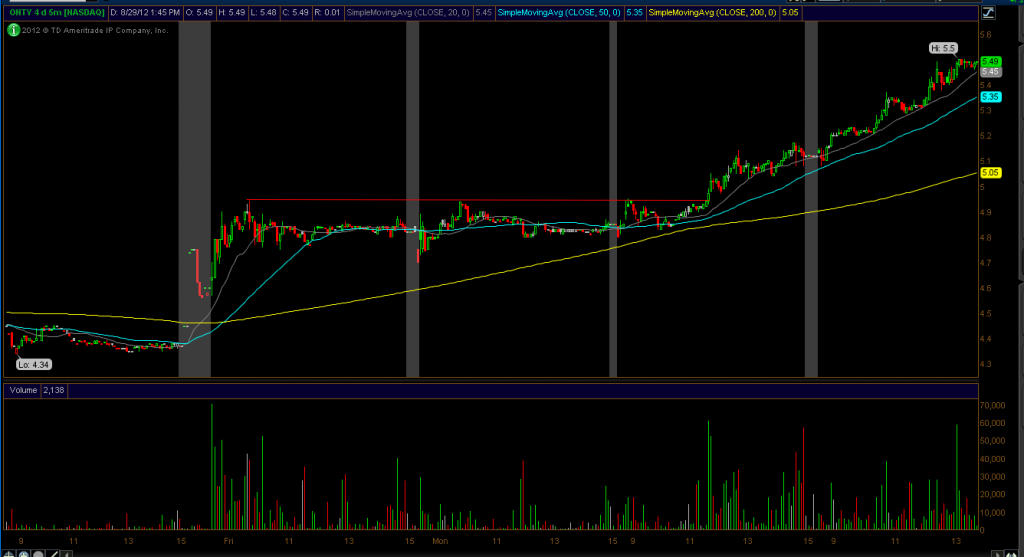
This is a four day chart of $ONTY. By viewing this chart, its obvious that the $4.95 level is the key break-and-bust-out level. The stock tapped that level three times before finally busting through. So, you find the setup using the daily chart and you pinpoint your entry using intraday time frames.
To learn more, email me at kunal@blog.blog.blog.bullsonwallstreet.com